What are the circumstances of the success of these parties? The results from a fresh survey conducted in Mariupol indicate that the Ukrainian nation-building process needs to overcome major hurdles in this city, most notably its population’s anti-western geopolitical inclinations and widespread identification with the Soviet Union.
Anyone hoping for a “pro-European” breakthrough in the eastern oblasts of Ukraine, or for signs of political deoligarchization, will have been left disappointed by the results of the first round of the local elections held on October 25th. In the mayoral elections of Mariupol, Metinvest (Akhmetov) candidate Vadim Boychenko obtained the trust of nearly of two thirds of the electorate, with the pro-Russian “Opposition Platform – for Life” candidate Volodymyr Klymenko earning more than a quarter of the votes.
Clearly, most of the electorate of the areas located near the Donbas war Line of Demarcation does not support political parties that promise to recalibrate Ukraine’s geopolitical orientation towards the West. This is nothing new. What warrants attention is the fact that the pattern persists despite years of military confrontation, the curtailing of Russian media presence, and sustained efforts at nation-building.
Overall, the outcome of the election illustrates the continued purchase of political narratives crafted in Moscow. Based on findings from a very recent survey conducted in Mariupol commissioned from the Kyiv-based Center for Social Indicators, this contribution describes the mood in the city in the months immediately preceding the election*.
“Europe” does not replace Soviet identity
Mariupol remains a Russian-speaking city: only 0.9% report regularly speaking Ukrainian at home, and a mere 8 respondents out of a total of 1251 chose to be interviewed in Ukrainian. Russian is the preferred language of 81.9%, followed by Russian and Ukrainian in equal measure (9.6%) and Surzhyk (7.3%). A whopping 88% opined that Russian should be elevated to the status of second official (state) language.
Language is of course not the only way to assess national identification, particularly in Ukraine, for there are plenty of people who identify as Ukrainian and prefer communicating in Russian. Moreover, people do not necessarily only identify at the national level – regional and supranational identifications (particularly Soviet) may co-exist and perhaps even matter more for some.
Asking about feeling Ukrainian or Russian, but also Soviet or “European”, and allowing for multiple identifications and different degrees of identification, is therefore more straightforward. As shown in Graph 1, well over 80% of Mariupol’s population identifies as Ukrainian, but unlike in Dnipro and Kharkiv, which are also mainly Russian-speaking, the share of confident answers (“definitely yes”) is rather low (37.8%)**. Almost half identify as Russian, although only a small share of this group feels strongly this way.
Graph 1: Self-identification of Mariupol residents as Ukrainian, Russian, Soviet and European (multiple identifications possible)
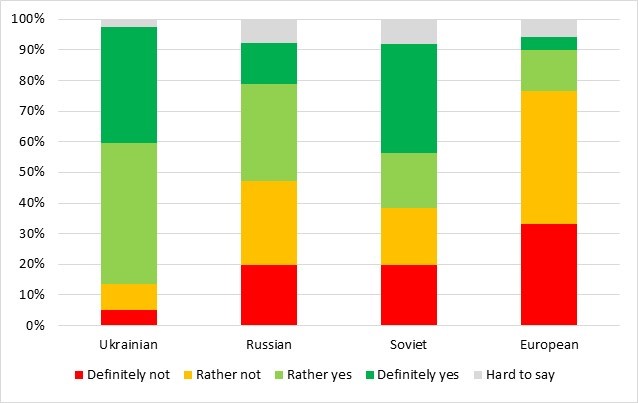
Note: for exact data see Table A1 and A 1.1 in Appendix.
Graph 2: Share of Mariupolitans identifying as “European”, by age.

Note: for exact data see Table A2 in Appendix.
Graph 3: Share of the population of Mariupol that identifies as “Soviet”, by age.
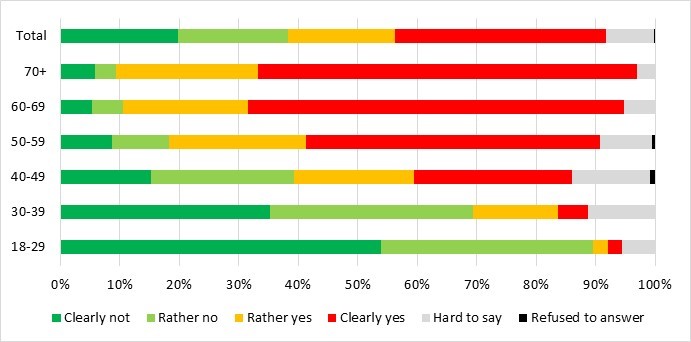
Note: for exact data see Table A3 in Appendix.
Thus, national identities seem to be somewhat blurred, and many feel both Ukrainian and Russian. At the supra-national level, more than half of the population identifies as Soviet, and while there may be various reasons for doing so, this stands in contrast with the share identifying as “European”, which is less than one fifth, very few of which chose the “definitely yes” option. Notably, while feeling Ukrainian or Russian often overlaps with feeling Soviet or European, few respondents reported feeling both Soviet and European, indicating that these categories are fundamentally geopolitical.
National and supra-national identification is, expectably, associated with age. Those who identify as Russian and/or Soviet are, on average, older than those who do not, whereas the inverse is true for those who identify as Ukrainian and, especially, European. However, even among the youngest cohort (18-29) those who feel European are a minority, with more than 60% feeling not European, and less than 5% feeling clearly European (Graph 2).
Overall, the age effect is by far the strongest in relation to Soviet identification: among those aged 18-29, only 2.5% feel clearly Soviet, whereas more than 63% do so among those aged 60 and above. This figure rises beyond 85% were one to include those who feel “rather” Soviet (Graph 3).
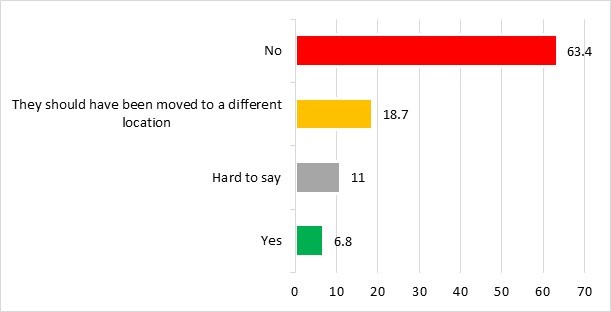
Summing up, Soviet identity will slowly disappear as the age groups that cherish it move up the population pyramid, but it is not being replaced by European supranational identification. However, it is unclear whether national identities might be filling in the void. For now, Mariupolitans seem hesitant about claiming them. They also seem to be sceptical about enacting a clean break with the past: less than 7% believe that tearing down the Lenin statues was necessary, even though almost 19% would have preferred compromising by moving them to (less conspicuous) new sites (Graph 4).
Graph 4: Was it necessary to tear down the Lenin monuments starting from 2014 (percentages)?
Geopolitical inclinations
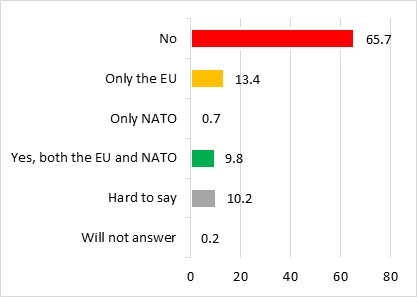
The geopolitical “mood” in Mariupol should thus be seen against the background of generally weak, blurred or overlapping national identities. From the perspective of Ukrainian nation-building, this is a serious challenge, and it certainly reverberates on the prospects for successful integration into the EU and NATO. Graph 5 displays the respondents’ preferences in this regard. Almost one quarter would want Ukraine to join the EU, and about one in ten is in favour of joining NATO. While some may favour a “multi-vector” approach to foreign policy, there is reason to believe that those who are not in favour of joining the EU and/or NATO are primarily eastward-looking in their preferred geopolitical orientations. Worryingly, the size of this constituency in Mariupol in 2020 is even greater than its Luhansk equivalent in 2013 (cf. Gentile 2015: 211).
Graph 5. Should Ukraine join the European Union and/or NATO (percentages)?
Even so, an eastern geopolitical orientation does not necessarily mean open support for the Kremlin and its policies towards Ukraine, nor does it imply hostility towards the central government in Kyiv.
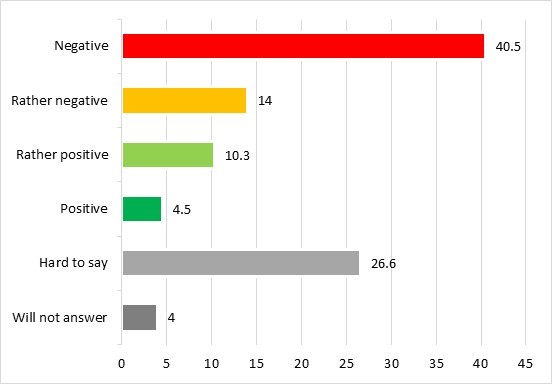
Unfortunately, Moscow’s grip on the hearts and minds of many Mariupolitans becomes visible in the answers given to numerous attitudinal questions. Graph 6 describes self-reported (or admitted) support for the “Donetsk People’s Republic” (DPR) in 2014. Because of the political sensitivity of this question, it may be assumed that the illustration offered is very conservative, and that the degree of true support, or at least non-objection, was higher. Nevertheless, while only 14.8% admitted to supporting the DPR, 30.6% were not willing to express an opinion (“hard to say” or refused to answer). While we cannot be certain about the motivations behind this indecisiveness, it is not a far stretch to assume that this group is a substantial reservoir of passive or active DPR sympathizers. What we do know is that only about 40% were willing to distance themselves from the DPR completely.
Graph 6. How did you feel about the idea of the formation of the “Donetsk People’s Republic” in 2014?
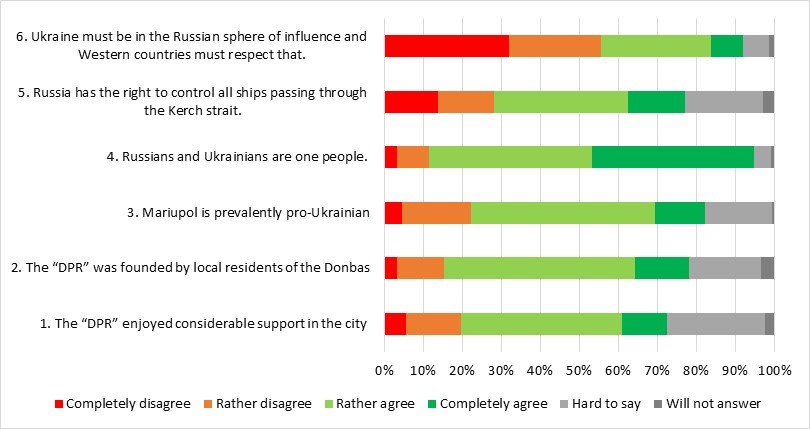
The respondents’ assessment of six geopolitically relevant statements sheds more light on this situation (Table 1). Each of these statements is likely to attract some “tactical” answers, so the extent of pro-Ukrainian sentiment is likely somewhat overestimated, whereas anti-Ukrainian opinions are likely underestimated.
First of all, the majority believe that the DPR enjoyed considerable support (1), and even more are of the opinion that the organization’s foundation was a local initiative (it was not) (2). It is therefore somewhat surprising that the majority of respondents view Mariupol as prevalently pro-Ukrainian (3). The suggestion that Russians and Ukrainians are “one people” – a notion strongly supported by the Kremlin while being rejected by official Kyiv – received overwhelming support (4).
The final two statements represent a litmus test of strong pro-Russian sentiment: “Russia has the right to control all ships passing through the Kerch strait” (5) and “Ukraine must be in the Russian sphere of influence and Western countries must respect that” (6). Stunningly, about half agreed with the first of these two statements, with many more undecided, despite the fact that Russia’s actions in the Kerch strait existentially endanger the economy of Mariupol. However, the share who believe that Ukraine should unambiguously belong to Russia’s sphere of influence is less than one third, with an additional 8% unwilling or unable to have an opinion. However, it is also notable that only 32% fully acknowledge Ukraine’s right to make its own choices.
Table 1. Assessment of geopolitically “flavoured” statements (row percentages).
| Completely disagree | Rather disagree | Rather agree | Completely agree | Hard to say | Will not answer | |
| 1. The “DPR” enjoyed considerable support in the city | 5.5 | 14.1 | 41.3 | 11.8 | 24.9 | 2.5 |
| 2. The “DPR” was founded by local residents of the Donbas | 3.2 | 12.0 | 49.1 | 13.9 | 18.4 | 3.4 |
| 3. Mariupol is prevalently pro-Ukrainian | 4.6 | 17.7 | 47.2 | 12.8 | 17.1 | 0.6 |
| 4. Russians and Ukrainians are one people. | 3.3 | 8.1 | 41.9 | 41.5 | 4.4 | 0.8 |
| 5. Russia has the right to control all ships passing through the Kerch strait. | 13.8 | 14.4 | 34.2 | 14.7 | 20.0 | 2.9 |
| 6. Ukraine must be in the Russian sphere of influence and Western countries must respect that. | 32.0 | 23.6 | 28.3 | 8.0 | 6.7 | 1.4 |
Note: graphical presentation of this table can be found in graph A in the Annex.
Summing up, two main findings have been presented. The first is that the respondents appear to be surprisingly frank in revealing opinions that contradict the nationwide narrative of Ukrainian unity. The second is that Mariupol’s population is divided between a large openly pro-Russian minority of at least 40 percent and a small explicitly pro-Ukrainian and pro-European minority, represented by between 10 and 20% of the population, probably closer to 10%. The remainder of the population’s allegiances and identities seems to be up for grabs.
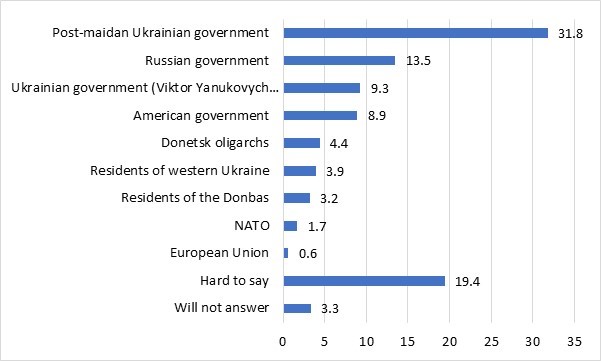
Considering the above, it may come as no surprise that the population’s primary blame attribution for the Donbas war falls on the Ukrainian side, while only 13.5% blame Russia (Table 2). There is a risk that the imminent threat of a Russian invasion in 2014-2015 may have ignited more hopes than fears in Mariupol. This is an elephant so big that it is easiest to detect when seen from a distance. Certainly Moscow sees it; in the meantime Kyiv’s response appears to have been ineffective, while an uneasy silence reigns in Mariupol.
Table 2: Primary blame attribution for the Donbas war (percent).
| Post-maidan Ukrainian government | 31.8 |
| Ukrainian government (Viktor Yanukovych presidency) | 9.3 |
| Donetsk oligarchs | 4.4 |
| Residents of the Donbas | 3.2 |
| Residents of western Ukraine | 3.9 |
| Russian government | 13.5 |
| NATO | 1.7 |
| American government | 8.9 |
| European Union | 0.6 |
| Hard to say | 19.4 |
| Will not answer | 3.3 |
Note: graphical presentation of this table can be found in graph B in the Annex.
Funding
This research was funded by the Research Council of Norway, project 287267 “Ukrainian geopolitical fault-line cities: urban identity, geopolitics and urban policy.”
References
Gentile, M. (2015), West-oriented in the east-oriented Donbas: a political stratigraphy of geopolitical identity in Luhansk, Ukraine, Post-Soviet Affairs 31 (3): 201-223.
Matsuzato, K. (2018), The Donbas War and politics in cities on the front: Mariupol and Kramatorsk, Nationalities Papers 46 (6): 1008-1027.
Appendix. Data tables.
Table A1. Self-identification of Mariupolitans. Multiple answers possible
| Ukrainian | Russian | Soviet | European | |
| Definitely not | 5.2% | 19.6% | 19.8% | 33.3% |
| Rather not | 8.3% | 27.5% | 18.6% | 43.3% |
| Rather yes | 46.1% | 31.7% | 18.0% | 13.5% |
| Definitely yes | 37.8% | 13.4% | 35.4% | 4.3% |
| Hard to say | 2.5% | 7.6% | 8.1% | 5.7% |
| Answer refused | 0.1% | 0.3% | 0.2% | 0.0% |
Table A1.1
| Identification as (column percentages): | ||||||||
| Ukrainian | Russian | Soviet | European | |||||
| Percent | Mean age | Percent | Mean age | Percent | Mean age | Percent | Mean age | |
| Definitely not | 5.2 | 58.03 | 19.6 | 47.45 | 19.8 | 37.07 | 33.3 | 53.80 |
| Rather not | 8.3 | 56.86 | 27.5 | 47.00 | 18.6 | 39.10 | 43.3 | 51.07 |
| Rather yes | 46.1 | 51.31 | 31.7 | 53.97 | 18.0 | 56.02 | 13.5 | 44.79 |
| Definitely yes | 37.8 | 47.15 | 13.4 | 55.21 | 35.4 | 62.64 | 4.3 | 49.39 |
| Hard to say | 2.5 | 54.15 | 7.6 | 49.80 | 8.1 | 45.70 | 5.7 | 43.34 |
| Answer refused | 0.1 | n.a. | 0.3 | n.a. | 0.2 | n.a. | 0 | n.a. |
Table A2. Do you feel European? (per cent)
| Age | Clearly not | Rather no | Rather yes | Clearly yes | Hard to say |
| 18-29 | 24.5 | 36.2 | 24.54 | 4.9 | 9.8 |
| 30-39 | 29.6 | 43.75 | 12.9 | 4.6 | 9.2 |
| 40-49 | 28.8 | 44.5 | 19.2 | 3.9 | 3.5 |
| 50-59 | 27.4 | 48.1 | 12.98 | 5.3 | 6.25 |
| 60-69 | 44.4 | 42.9 | 5.8 | 3.7 | 3.2 |
| 70+ | 43.8 | 41.96 | 7.6 | 3.6 | 3.1 |
| Total | 33.2 | 43.2 | 13.6 | 4.3 | 5.7 |
Table A3. Do you feel Soviet? (per cent)
| Age | Clearly not | Rather no | Rather yes | Clearly yes | Hard to say | Refused to answer |
| 18-29 | 54 | 35.6 | 2.5 | 2.5 | 5.5 | |
| 30-39 | 35.3 | 34 | 14.3 | 5 | 11.3 | |
| 40-49 | 15.3 | 24 | 20.1 | 26.6 | 13.1 | 0.9 |
| 50-59 | 8.7 | 9.6 | 23.1 | 49.5 | 8.7 | 0.5 |
| 60-69 | 5.3 | 5.3 | 21.1 | 63.2 | 5.3 | |
| 70+ | 5.8 | 3.6 | 23.8 | 63.7 | 3.1 | |
| Total | 19.8 | 18.5 | 18 | 35.3 | 8.1 | 0.2 |
Graph A. Assessment of geopolitically “flavoured” statements (row percentages).
Graph B. Primary blame attribution for the Donbas war (percent)
* The survey was conducted on a representative sample of 1251 persons aged 18 and above who were interviewed between July and September 2020. The response rate is 31%, and the results are weighted in accordance with the city’s age-sex composition.
** For comparison, respectively 67.6 % and 62.0 % of the populations of Dnipro and Kharkiv answered “definitely yes” to the question in comparable surveys commissioned by this author from the Center for Social Indicators in 2018.

Attention
The author doesn`t work for, consult to, own shares in or receive funding from any company or organization that would benefit from this article, and have no relevant affiliations