Today, the media have entered the era of digitization. For example, the once-popular newspaper Dzerkalo Tyzhnia ceased to be printed going completely online. However, having a website is not enough. Nearly all media outlets have their pages on Facebook and Instagram, YouTube channels, podcasts and more. That is, they are offering their audience a variety of content formats. But is their content different on different platforms?
Media researchers once came up with the formula: “The medium is the message“, emphasizing that communication platforms can be a more important focus of study than content. Roughly speaking, messages on Facebook and websites can differ so greatly that the readers of the same media will get fundamentally different messages, reading it on different platforms.
But is this true for the Ukrainian media today? To answer this question, we decided to analyze thematic content and sentiment of media outlets’ Facebook pages and websites. Is there a difference between the platforms and, if so, what is it exactly? Let us try to figure it out.
VoxUkraine analysts Nazar Moshnyaga and Oksana Tymchenko analyzed 63,000 pieces posted on social networks by popular Ukrainian media outlets in October and November 2020, as well as on their websites. They found that the sentiment of the posts on Facebook and the websites is nearly the same (being mostly negative) and that the media write more about politics and the coronavirus pandemic on social media than on their websites. Read the article for detailed results about the media outlets and topics.
Disclaimer: The article was prepared as part of the Media Ecosystem project with the support of the US Embassy. Under the project, we explore the Ukrainian media space, analyze the news by the most popular online media outlets to provide up-to-date, aggregate information on topics, messages and connections between the media.
Main conclusions:
- The media write much less on their Facebook pages than on their websites. Perhaps the media outlets choose the most interesting material to be posted on social networks or stuff that can provoke a reaction from the readers. The number of posts, however, is not related to the average number of reactions a media outlet receives per post.
- The media write more about politics and the coronavirus on Facebook than on their websites but less so about the economy, culture and sports (the latter is accounted for by the fact that the top four media outlets have separate sports pages on Facebook, but those are not part of our analysis). The biggest thematic difference between webpage content and FB content is observed for Vgolos (94 percentage points) and the smallest for Babel (8 percentage points).
- On average, Facebook content is a little more negative than website content. Overall, one cannot say that the media try to play on emotions or “shoo away betrayal” on social networks since for most topics and media outlets, the difference between the proportion of negative and neutral news on FB and websites is not that big.
- However, negative sentiment prevails on both the media outlets’ websites and Facebook pages, with 45% negative, 28% neutral and 27% positive posts on the websites versus 46%, 29% and 24% on Facebook, respectively.
How we calculated: Research was conducted in October and November 2020. We selected the main FB pages of 33 popular Ukrainian media outlets. Some media have different pages in Ukrainian and Russian. In such cases, we chose in favor of the version listed on their main webpage, or in favor of the Ukrainian version, if both were listed. Secondary pages, such as UA:Culture, NV Life, UNIAN weather, sports pages, etc. were also left out of the analysis. Eventually, using the CrowdTangle tool, we obtained an array of 64,055 posts including their text, type, page, attached links, etc.
Next, we classified 63.3 thousand posts and 241.6 thousand news pieces by topic and sentiment. To classify the posts by topic and sentiment, we used the news texts attached to the post, and, if there was no news there, we directly used the contents of the posts. For more about the classification algorithms that we applied, read our previous articles: 1, 2. Note that neutral pieces can be both sentiment-free or comprised of a balanced number of negative and positive sentences.
For the extended methodology, see the end of this article.
For simplicity’s sake, by “news” and “articles” and “pieces” we mean all material from the websites, included in our analysis (this comprises news pieces and can include articles and columns, depending on the media outlet’s website structure and our technical capability for downloading website content). We refer to pieces published on Facebook pages as “posts”.
In 2019, social networks were already ahead of television as the main source of news for Ukrainians. In the course of 2020, television lost its position to social media even more. Online media platforms also lost some visitors, but the gap between them and television decreased from 7 to 4 percentage points in 2020. At the beginning of 2021, already 60% of the population got registered on social networks compared to 40% a year before.
The “traditional” media – among them also online media – have to follow in the tracks of their audience and go to social networks so as not to lose them. Media outlets actively use social networks to promote their content. Nearly 90% of the posts we researched contain links to website pages (Figure 1). The media mostly share news, articles and blogs from their websites.
Figure 1. The number of posts by type
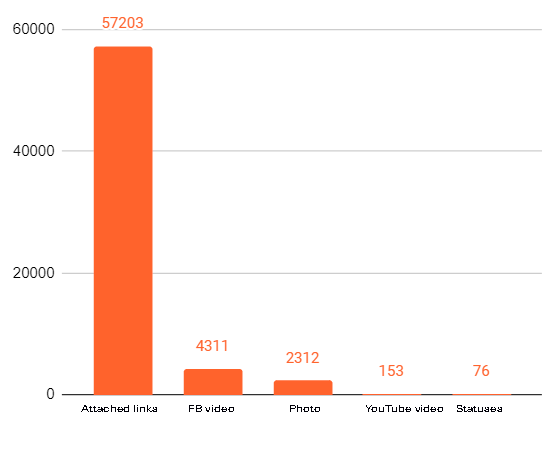
Source: CrowdTangle, own calculations
The media, however, do not post on their FB pages all the news from their websites (Figure 2). This suggests that online media outlets select posts for social networks that can generate as much reaction as possible, and also get the readers to follow the link to know more.
Figure 2. The number of news pieces on media websites and posts on their Facebook pages, on average per day
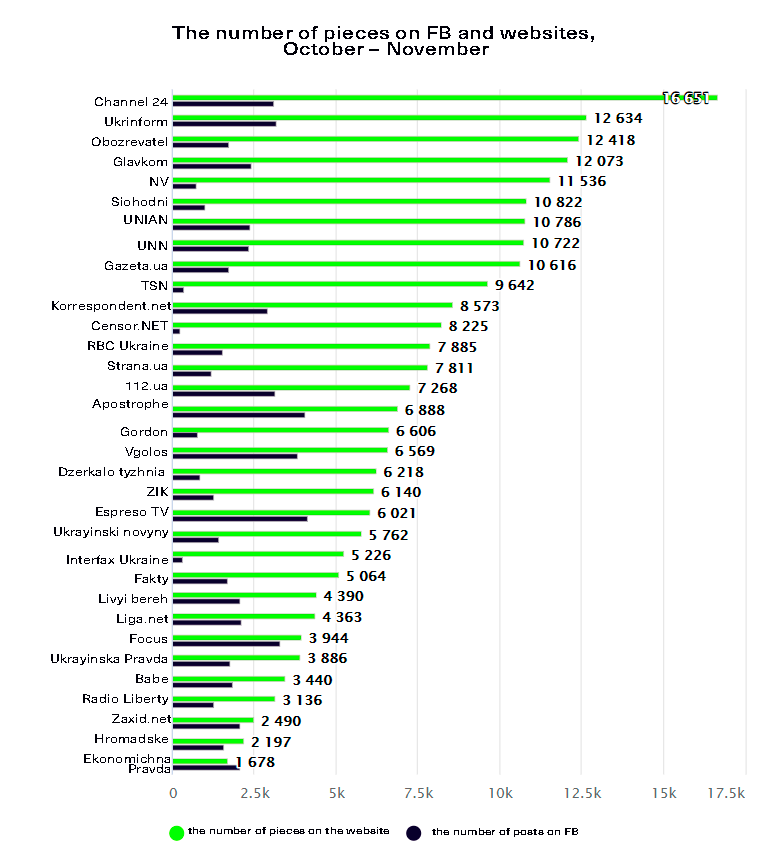
Source: CrowdTangle, own calculations
As seen in Figure 2, only Hromadske’s Facebook activity exceeds the frequency of updating its website. The rest of the media outlets post on social networks much less than they publish on their websites. On average, online media publish 32 posts a day. While twice as much (63-67 posts a day) is posted by TSN, Obozrevatel and RBC. Ekonomichna Pravda, Ukrayinski Novyny and Interfax Ukraine post the least of all, averaging 3-5 posts a day.
The number of posts, however, is not related to the number of interactions with them (correlation coefficient ≈ 0.04). By “interaction” we mean likes, comments or shares.
On average, one post has 268 interactions. For Radio Liberty, however, this figure is eight times higher (Figure 3). Overall, only eight of the outlets we reviewed have an above-average interaction rate with posts. Interfax Ukraine and Ukrayinski Novyny have the lowest rate, with an average of 2.7 interactions per post.
Of course, some interactions may be generated by bots, so we provide this data only to get an idea of the pages’ popularity.
Figure 3. The average number of interactions per post for the media outlets in question
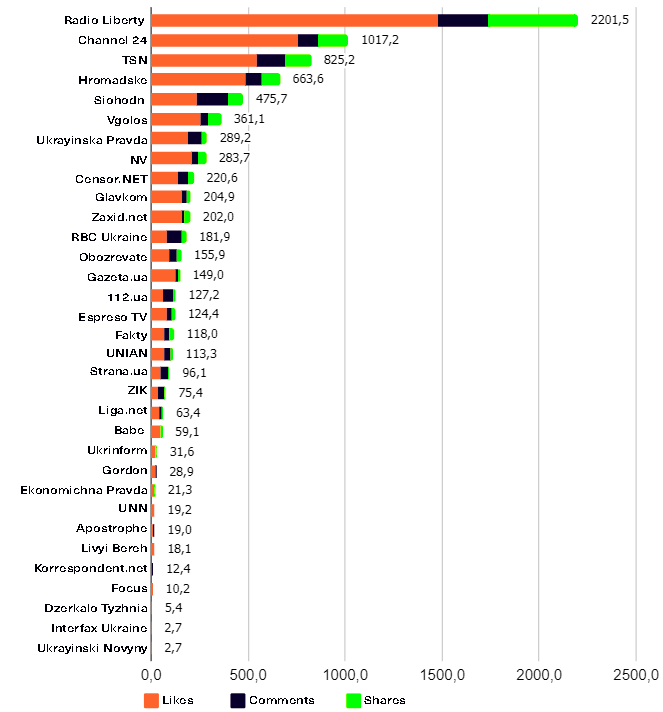
Source: Interaction data (likes, comments, shares) obtained using the CrowdTangle tool, own calculation
Post topics: Facebook has more politics and coronavirus, less economy and culture
The distribution of post and news topics on media websites is very similar (Figure 4). The biggest difference is in “sports”, which is featured 4.7 percentage points less on Facebook. This is due to the fact that the top four “sportiest” media (according to the number of sports news on their websites) – Siohodni, Channel 24, Obozrevatel and Espreso TV – having separate sports pages on FB (Channel 24’s page is dedicated to football) were left out of this analysis.
The media’s Facebook pages are more “politicized” than their websites, with the proportion of posts on politics on FB being 4.1 percentage points higher than on their websites. The media also wrote about the coronavirus pandemic 2.9 percentage points more on social networks compared to the news on their websites.
“Economy” appeared 2.1 percentage points more in the news on the media’s websites than in their Facebook posts. As for the other topics, the difference was 1.8 percentage points or less.
It is possible that the media are trying to “make” the Facebook algorithm “elevate” their post, hence they post more on the topics that will not leave the majority of people indifferent. After all, political battles are quite fierce on Facebook and the coronavirus pandemic is a topic that nearly everyone is worried about.
Figure 4. Percentage of the media’s post and news topics
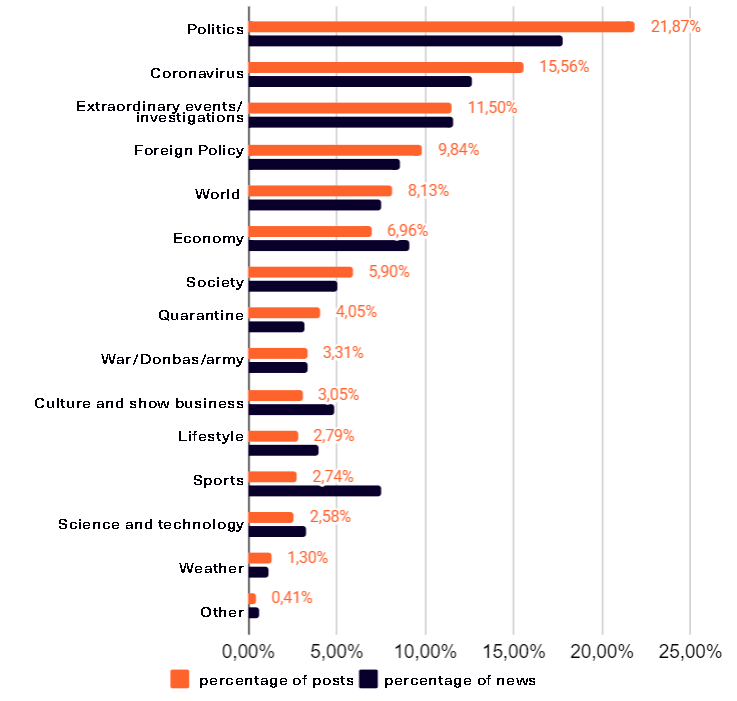
Source: own calculations. Using a trained algorithm, we classified the posts/news into 15 topics. More information can be found in the article “The topics of the month“.
Is Facebook a “territory of betrayal”? Spoiler: nope
We decided to check whether the media outlets show more emotion in their posts than on their websites. To do that, we determined the tone of the news and posts (if a post contained a link, its sentiment was determined by the sentiment of the article in the link). Figure 5 shows that news pieces about “lifestyle”, “culture/show business” and “society” are generally more positive on media websites than on Facebook, while news about war, peace, the coronavirus pandemic/quarantine are slightly more negative. In other categories (except for “weather”), there is almost no difference between the sentiment of the websites and Facebook pages.
Figure 5. Comparison of the sentiment of topics on the media’s Facebook pages and websites
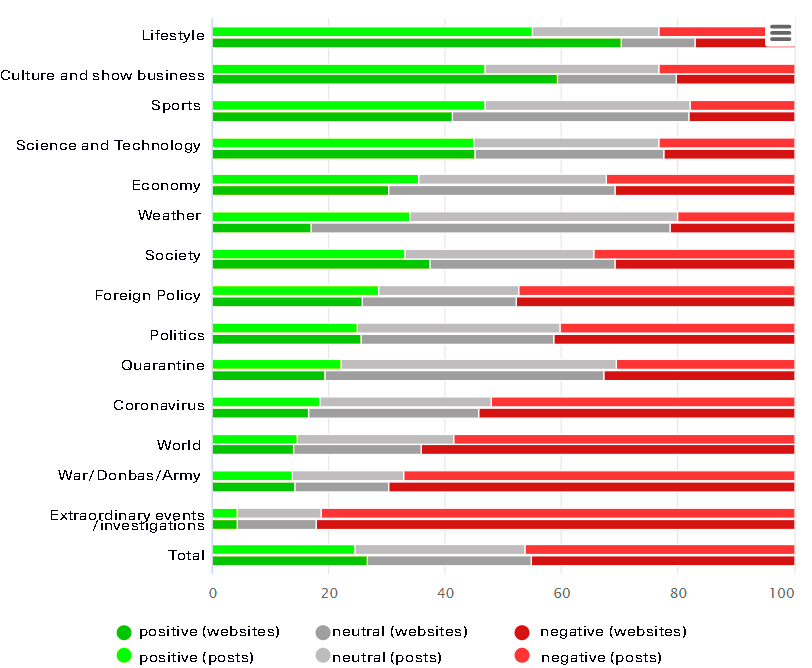
Source: own calculations. The definition of tonality includes searching (dictionary-based) for colorful words, i.e. amplifying, weakening, negative, opposite, conditional words. Then, the words/phrases identified according to sentiment analysis dictionaries are assigned values: a negative sentiment gets a negative value, and a positive sentiment gets a positive value. The last step is to sum up all the values from the text. If the sum is less than -1, the text has a negative sentiment, if it is more than +1 – a positive sentiment, if from -1 to +1 – a neutral sentiment. Read more about the algorithm used to determine sentiment in the article “How do Ukrainian media cover the most popular topics?” . The topic “Other” is not in the Figure because it is residual.
“Weather” on FB was 17 percentage points more positive than on the websites. In their positive posts, the media disseminated news about the “warm fall weather” or shared photos of the first snow. Among the negative posts were those about the weather that would “drastically change for the worse”, polluted air in Kyiv, etc.
By contrast, “lifestyle” on FB was 15.7 percentage points less positive than on the websites. Among the positive posts were pieces about diets, such as “It’s real easy to eat healthily and well! – as proved by a well-known fitness coach in her interview for LIGA.Life” or recreation: “We’ll tell you how to holiday without having to spend much in Ukraine this fall”. Among the posts with a negative tone, many were about disease and harm to health.
Finally, “culture and show business” was much less positive on Facebook than on the websites (12.4 percentage points). Negative posts concern deaths or the illnesses of celebrities, scandals and more. Posts about the life of well-known people, film/TV series reviews, playbills, etc. were positive. Naturally, there were also posts like “Star X pleased the fans with spicy photos”.
Figure 5 suggests that the media outlets do not try to play on the readers’ emotions or “shoo away betrayal” on Facebook. To verify this, the following questions need to be answered:
- Is the proportion of neutral news smaller on Facebook than on the websites? (If so, then positive and negative posts on Facebook, respectively).
- Is the proportion of negative news larger on Facebook than on the websites? (If so, then the media outlets use Facebook to spread “betrayal”).
In order to answer these questions, we will test the following hypotheses: (1) the proportion of neutral news on websites is the same as on Facebook pages, and (2) the proportion of negative news on websites is the same as on Facebook pages. We use a χ2 test for equality of proportions. First, we test the hypotheses for each of the topics and then for individual media below.
Figure 6 shows this test’s results. We reject the first hypothesis in whole and for most topics except “coronavirus”, “science and technology” and “society”. Overall, the proportion of neutral posts is slightly higher than that of neutral news (29% v. 28%). Topics such as “weather”, “economy” and “sports” are less neutral on Facebook, while “culture”, “lifestyle”, “peace” and “war” are more neutral.
We also reject the second hypothesis that the proportion of negative news is generally higher on Facebook than on the websites. However, the difference is not that big (46% on FB v. 45% on the websites). “Economy”, “lifestyle”, “culture” and “society” are more negative on FB than on the websites (however, the difference is small – from 3 to 6 percentage points). “War”, “coronavirus”, “extraordinary events” and “world” are less negative on Facebook than on the websites (the difference is 1-5.5 percentage points). For the rest of the topics, the difference is statistically insignificant.
The media outlets’ Facebook pages are thus a wee more neutral and a wee more negative than their websites. However, there are no big differences between them in these parameters for all the topics except “weather”.
Figure 6. The difference between the proportion of neutral/negative publications on Facebook and media websites by topic
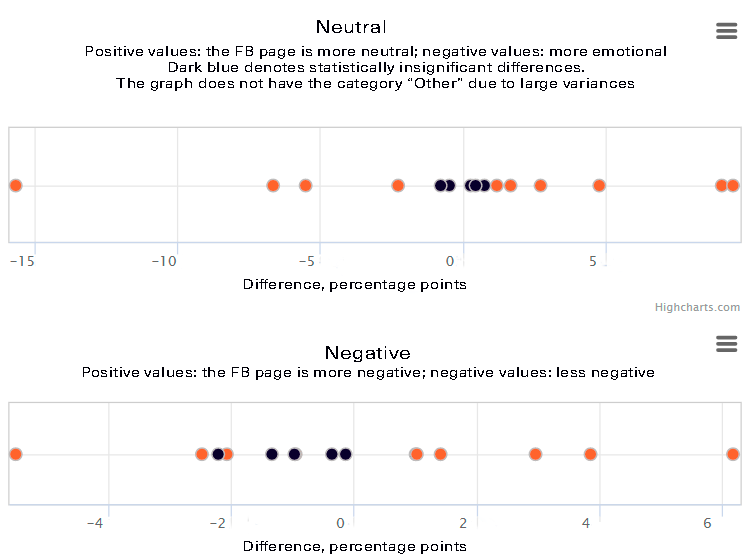
Source: own calculations. Dark blue denotes topics with a statistically insignificant difference. In the “Neutral” graph, those to the left of zero are topics where Facebook is more emotional than the websites; those to the right of zero are topics where Facebook is more neutral. In the “Negative” graph, those to the left of zero are topics where the websites are more negative than Facebook; those to the right of zero are topics where the websites are more positive (i.e. the proportion of negative news is smaller there).
Do these media run their websites and Facebook pages in a similar fashion? Spoiler: still no.
We analyzed the “average temperature across the hospital” above. Now let us take a look at individual media outlets – whether there are media out there whose websites and Facebook pages differ a great deal.
How different is sentiment on individual media outlets’ websites and FB pages?
With regard to media outlets, we also checked (1) whether the proportion of neutral news on their webpages and FB pages differs and (2) whether the proportion of negative news differs.
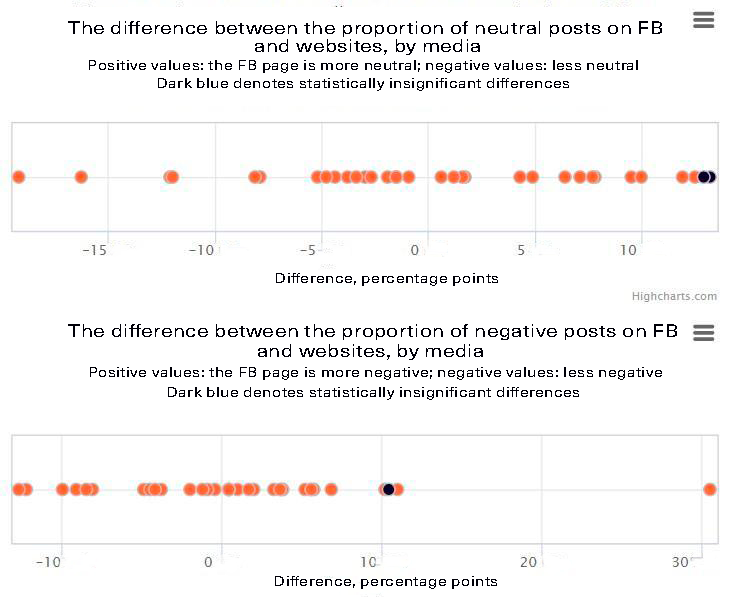
For most media outlets, the proportion of neutral news is lower on Facebook than on their websites. The biggest difference is observed for Vgolos, RBC Ukraine, Channel 112 and Ekonomichna Pravda. However, there were some media whose Facebook content was more neutral than their website content, e.g. ZIK, Censor.NET and Hromadske. The proportion of neutral news on the websites and FB pages of NV, Ukrayinski Novyny and Ukrinform does not differ statistically.
Only Dzerkalo Tyzhnia’s proportion of negative news on their Facebook page and webpage does not differ statistically. The media with the most negative Facebook content, as compared to their website, are Vgolos, Ukrayinski Novyny, Gazeta.ua and Ekonomichna Pravda. While Strana.ua, Ukrinform and Hromadske have the most positive Facebook content.
Figure 7. Testing the hypotheses about equal proportions of neutral and negative news on the websites and Facebook pages for the mass media in question
How are the topics of the posts on media websites different from their Facebook pages?
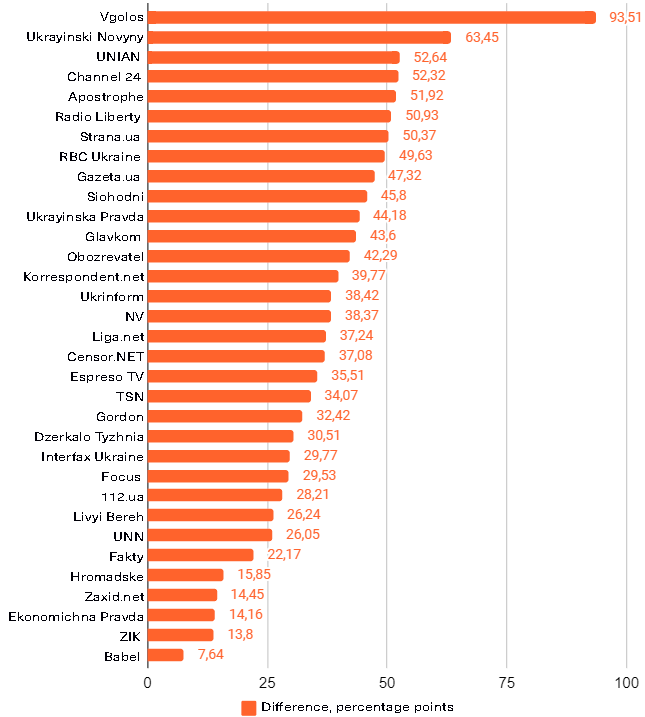
An indicator of the difference between a media’s FB page and its website is the sum of the absolute differences in the proportion of each topic, published on the website and on FB. Figure 8 shows a ranking of thematic differences between media websites and FB pages.
The rankings leader is Vgolos, with its Facebook page differing from its website by 94 percentage points. This is mainly accounted for by “extraordinary events/investigations” – this topic is featured by 46.4 percentage points more on Vgolos’s FB page than on its website. It is a record-breaking difference among all the media outlets (for comparison, Strana.ua ranks second in “politics” with its 16.2 percentage points difference between the FB page and website).
Also, the FB page of Ukrayinski Novyny differs noticeably from its website – by 63.4 percentage points. This is mainly accounted for by “politics” which is featured on the agency’s FB page by 12.7 percentage points more than on its website.
Figure 8. Indicator of the difference in topics (the sum of the absolute differences in the proportion of topics on the media’s FB pages and websites)
Source: own calculations
As we mentioned earlier, the proportion of “politics” on FB differs the most from the websites. The FB pages of most media outlets are more politicized than their websites (Figure 9). For example, Strana.ua’s proportion of posts about politics is 16 percentage points higher on Facebook than on its website. Some media (e.g. Vgolos, Gordon, Ukrinform and Babel) write less about politics on Facebook than on their webpages.
Figure 9. The difference between the proportion of posts about “politics” on the media’s Facebook pages and websites, percentage points
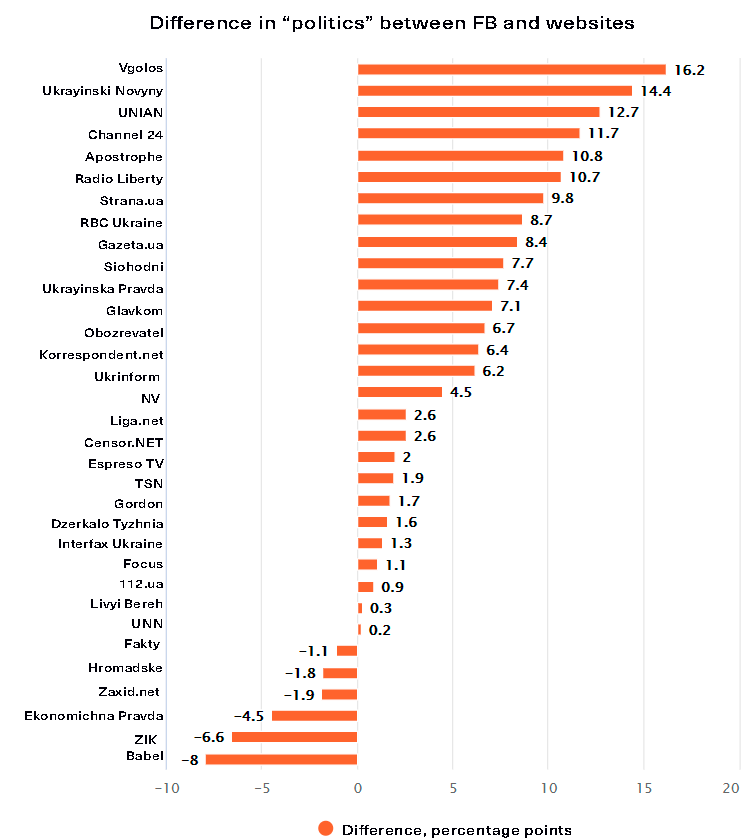
NB: A positive difference means that the media has a larger proportion of posts about politics on its Facebook page than on its website; a negative difference means a smaller proportion, respectively.
In contrast to “politics”, most media outlets wrote much less about the “economy” on Facebook than on their websites (Figure 10). For example, for Liga.net, this difference is 12 percentage points. UP, NV, EP and Strana.ua have more “economy” on their websites compared to their Facebook pages.
Figure 10. The difference between the proportion of posts about the “economy” on the media’s Facebook pages and websites, percentage points
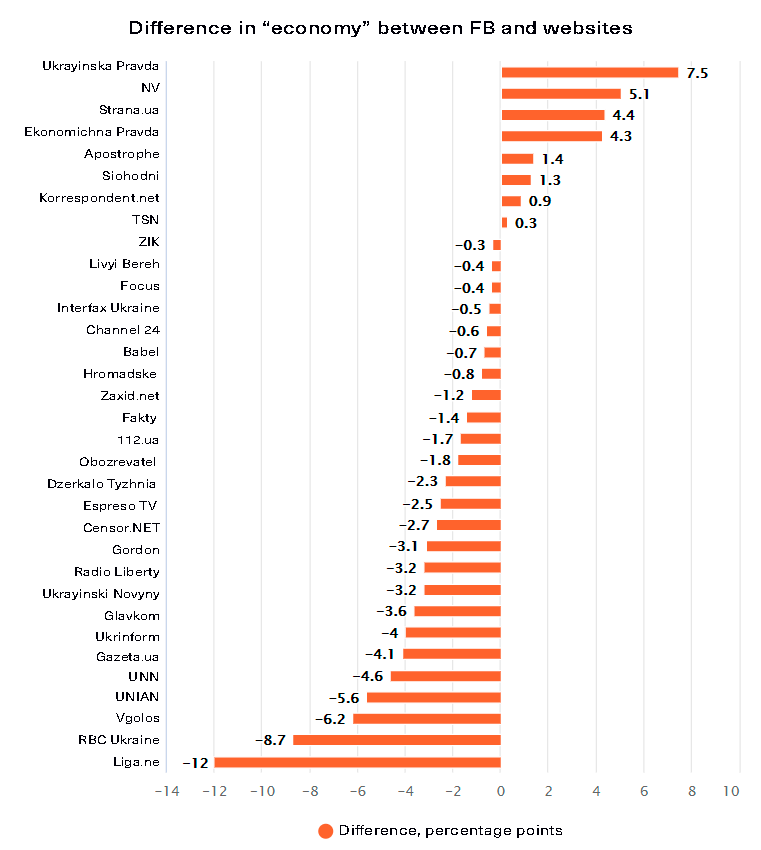
NB: A positive difference means that the media has a larger proportion of posts about the “economy” on its FB page than on its website; a negative difference means a smaller proportion, respectively.
For more details between the media outlets’ websites and FB pages in terms of topics, see the table on the dashboard
Instructions for the dashboard: you can choose four indicators in the dashboard. Clicking on the button with the name of the indicator will take you to the filters. The “Back” button will take you back to selecting indicators. The “Proportion of Topics” and “Sentiment” show the percentage of topics or sentiment in all the posts/news by a media.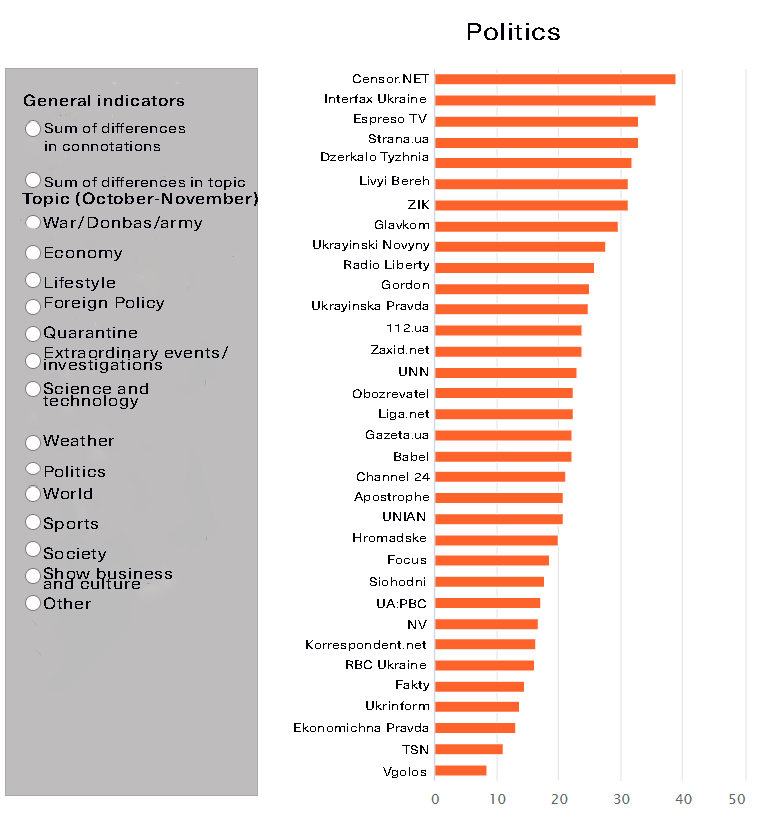
The aggregate data used in the article can be seen in the table.
Finally, let us see if there is a significant difference in how the media outlets write about certain topics on their websites and Facebook pages. We looked into whether the difference in the proportion of neutral and negative news on each topic and for each media was statistically significant. The significant results are presented in Table 1.
Table 1. Differences between the posts and websites by topic and media (only significant results)
| Topics | Media outlets whose posts are more neutral and less negative than news on their website | Media outlets whose posts are less neutral and more negative than news on their websites |
| Politics | Channel 24 and ZIK | – |
| Extraordinary events/investigations | Radio Liberty, Siohodni, Ukrinform | – |
| Coronavirus | NV, Siohodni, Ukrayinski Novyny, Ukrinform, UNIAN, UNN | Gordon, RBC Ukraine |
| Economy | – | Ekonomichna Pravda |
| Quarantine | NV | – |
| World | Radio Liberty, Ukrinform | – |
Source: own calculations
Advanced methodology:
For our study, we compiled a list of Ukrainian online media outlets based on open rankings of the Ukrainian Internet Association of Ukraine, Gemius, Kantar, Similar web data, USAID-Internews studies, Institute of Mass Information and Detector Media monitoring.
We include media outlets in our study taking into account the following factors: the position in the rankings and the media studies mentioned above, the technical capability for collecting data, assessments of the media’s relevance from the editorial board and us as researchers.
Thus, the main FB pages of 33 popular Ukrainian media were selected. Politeka and Znay were not included in the study because their Facebook pages were blocked. UA:PBC was left out of the study because their website also contains news by their regional branches, hence it would be incorrect to compare their content with one FB page. Some media outlets have different pages for Ukrainian and Russian. In such cases, we chose in favor of the version listed on their main webpage, or in favor of the Ukrainian version, if both were listed. Secondary pages, such as UA:Culture, НV Life, UNIAN weather, sports pages, etc. were also left out of this analysis. Some of the differences between the media’s websites and FB pages can, therefore, be accounted for by the presence of such pages, but they will not play a major role in shifting the focus to FB compared to the websites.
For simplicity’s sake, by “news” and “articles” and “pieces” we mean all material from the websites included in our analysis (this comprises news pieces and can include articles and columns, depending on the media outlet’s website structure and our technical capability for downloading website content). We refer to pieces published on Facebook pages as “posts”.
To classify the posts by topic and sentiment, we used the news texts attached to the post, and, if there was no news there, we directly used the text of the posts. Then we selected posts and news with 10 tokens or more (these could be both words and punctuation marks, links, etc.). Posts without text were also rejected. As a result, the array of posts contains 63,347 units for topics (out of 64,055) and 63,343 for sentiment (less 4 because of insufficient hardware capabilities for determining sentiment in 4 posts), and 241,642 (out of 241,680) in the array of news. To learn more about the algorithms for classification by topic and sentiment, read our previous articles: 1, 2. Neutral pieces can be both sentiment-free or comprised of a balanced number of negative and positive sentences.


Attention
The authors do not work for, consult to, own shares in or receive funding from any company or organization that would benefit from this article, and have no relevant affiliations