Our analysis showed that the conditions on which Ukraine placed bonds, including private placement and issuance of eurobonds in euros, generally met market conditions, if comparing quotations of countries with comparable ratings (and this is a rather broad niche). But at the same time the price was paid for the emergency nature of the private placement, and the release in the euro was estimated by market much better immediately after the placement than the levels close to which Ukraine was placing. The main reason for the high rate of Ukrainian debt is the low creditworthiness of the country.
Over the past 12 months, Ukraine has entered the market with Eurobond issues three times. All three times, the government placed the securities under conditions that are typical for low-rated countries. To assess whether the conditions under which Ukraine attracted funds were adequate to the market, analysts compared the placement of eurobonds denominated in dollars and euros with market issuings from other countries with a similar credit rating.
Tabel 1. Some conditions for issuing of Eurobonds by Ukraine
| Start of the placement | Amount, mln | Maturity date | Coupon rate,% per annum | |
| Ukraine-24 (USD) | 25/10/2018 | 750 | 01/02/2024 | 8.994 |
| Ukraine-28 (USD) | 25/10/2018 | 1,250 | 01/11/2028 | 9.750 |
| Ukraine-28 (USD) | 13/03/2019 | 350 | 01/11/2028 | 9.93 |
| Ukraine-26 (EUR) | 13/06/2019 | 1,000 | 01/09/2026 | 6.75 |
Sources: emission prognose, Interfax, Economic Strategy Center / Centre for Economic Strategy сalculations
Placement in USD
The first and second placements on October 25, 2018 and March 13, 2019, were made in dollars (USD). In October, Ukraine issued two series of Eurobonds: seven years for $ 750 million with yield 8.994% per annum and ten years for $ 1.25 billion with coupon rate 9.75% per annum.
March placement is special because it was a additional additional placement of the previous issue. Ten-year notes of $ 350 million under the same conditions as the October issue of 2018 were sold to JP Morgan.
The bonds were sold at 98.88% of the nominal value, i.e. 98.88 cents per denomination dollar. This means that the yield of the placement, that is, the rate at which the Ministry of Finance attracted the debt, was higher than the coupon rate and amounted to 9.93% per annum. (Table 2).
| Amount,USD, mln | Maturity date | Coupon rate % | |
| Ukraine-24 | 750 | 1.02.2024 | 8,994 |
| Ukraine-28 | 1 250 | 1.11.2028 | 9,750 |
| Ukraine-28 | 350 | 1.11.2028 | 9,930 |
In order to analyze whether Ukraine could borrow cheaper, that is, whether the placement conditions were market-based, analysts should look first and foremost not for the profitability of the placement, but for the so-called spread: the difference between the return on placement and the interest rate of risk-free assets.
Thus, the analysis removes the effect of changes in interest rates in the world. For Eurobonds denominated in US dollars, a risk-free asset is Treasury Bond (USA). The rates on Ukrainian bonds will obviously be higher than US bonds, due to the country’s higher risk.
For comparison, the experts took Eurobonds of Ukraine with maturity in 2027, because they have a near maturity. This is important, because short-term rates and spreads are typically different from long-term bids and spreads over longer maturities.
Such a premium exists even when the difference between maturities is only one year. The graph below shows that the placement and additional placement of ten-year notes took place with a stable premium to the yield of Ukrainian securities, which were issued earlier and long-traded on the market.
The dynamics of the spread of Ukrainian Eurobonds with maturity in 2027 to the TB (US) by a blue color. The green indicates the spread of ten-year papers of Ukraine in placement – they correspond to fluctuations in the spreads of short-term bonds in the market.
Fig 1. Ukrainian bonds spreads with maturity in 2027 and 2028 to TB of USA
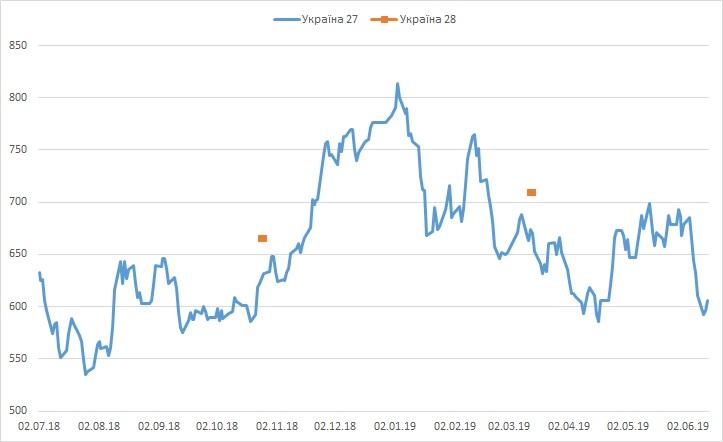
Source: Dragon Capital
To place Ukrainian plavements in a wider context, the experts compared the country’s data. For correct conclusions, they had to clear the spread of Eurobonds to US Treasury bonds when placed outside the influence of other factors, in particular, the ratio of investors to the entire group of countries – similar of Ukraine.
Investors value the risk not only of individual countries, but also of groups of countries, such as developed countries, developing countries, Latin American countries. Therefore, if investors start to “escape” from a certain group of states, then all countries of this group suffer, regardless of the economic situation in each individual country.
Ukraine belongs to a group of developing countries, and these trends are measured by the EMBI Global Diversified Index from JP Morgan Investment Bank.
The experts compared ten-year Ukrainian eurobonds with ten-year eurobonds placement in other emerging economies.
Because the spread varies according to the credit quality of the country, analysts put that data in a chart with credit ratings of the countries (the horizontal scale in the graph above). After all, credit rating is an integral indicator of creditworthiness, which takes into account many indicators, mainly economic ones.
In order to clear the data from the fluctuations inherent to the ascending (developing) markets and focus on the risk of Ukraine, experts looked at the difference between the spread of eurobonds and the EMBI index on the date of placement (vertical scale in Figure 1).
Fig 2. Connection between credit rating (1) and (2) spread difference on the securities placement and EMBI Global Diversified* index[8]
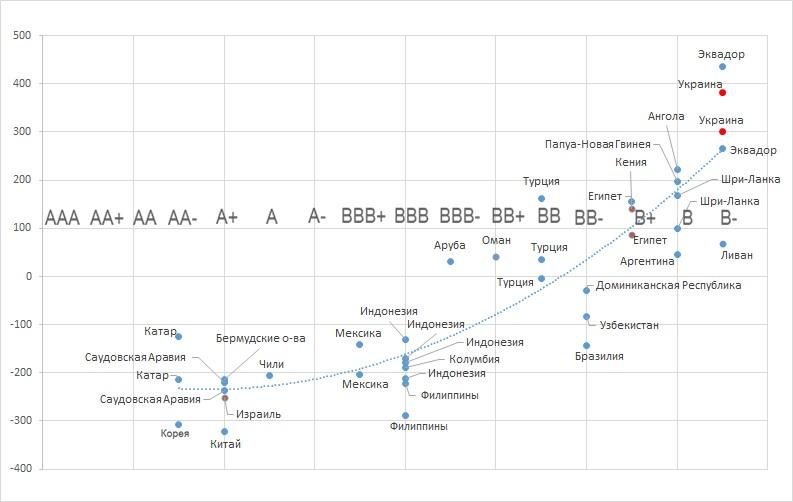
* Red marks indicate Ukrainian placement, Yellow – countries with war or State of Emergency
Sources: Cbonds; US Department of the Treasury; J.P. Morgan
In Figure 2 it can be seen that the private placement of ten-year bonds in March 2019 took place at worst conditions than the market placement of these bonds in 2018, which was almost on the trend line. At the same time, from October to March there were no significant fundamental changes for the worse in the economy.
Most likely, the reasons for the deterioration of the conditions were the height of the political struggle, uncertainty about cooperation with the IMF, and most importantly, Ukraine’s urgent need for financial resources was obvious to foreign traders: the Ukrainian government needed much money to repay external debt.
It was the payment for purely political risks, the delay in the reforms required for the IMF program and the emergency placement. The Ministry of Finance was put in a condition where it was impossible to settle cheaply.
Placement in Euro
On June 13, it became known that Ukraine placed seven-year eurobonds in 1 billion euros. Initially, the indicative rate for the issue was expected at the level of 7,125% per annum, but a fivefold excess of demand over the planned volume of placement allowed it to lower it to 6.75% per annum during placement, and for a week on the market yield of the issue decreased to 5.99% per annum.
There are less issuings in the euro on the market than in dollars, it has less liquidity (fewer buyers and lower volumes of trades), bonds are placed less often, and therefore the conditions of issuing even for the countries with the same ratings have very significant differences.
In addition, in the “junk” segment, where Ukrainian securities are traded, sharp movements in bond prices are very requent, so the accuracy of estimates suffers. As the risk-free rate pegged to the euroinstead of the US Treasuries a bid for Germany Eurobonds usually taken.
Experts compared the placement of Ukraine with the quotes on the secondary market of уurobonds of other countries of the rating group “B”.
Fig 3. Yield for Eurobonds denominated in Euro
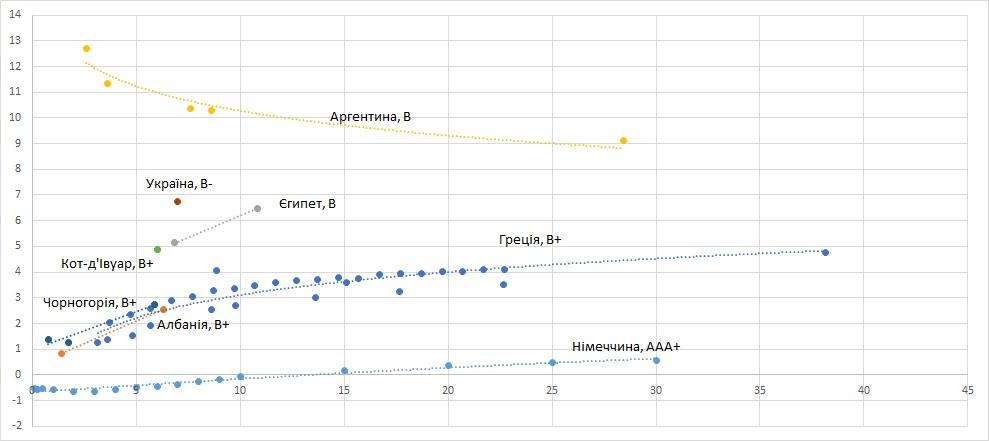
Sources: Cbonds, tradingeconomics.com, Investing.com
Ukraine placed seven-year securities with a yield of 160 b.p higher then the seven-year-old Egyptian securities, nevertheless, that Egypt has one level higher ranking han Ukraine. This approximates the price for one rating between the levels B and B- if we calculate it for data on dollar placements.
To compare the conditions for issuing eurobonds in euros and dollars, when countries have issues in both currencies, compare their spreads to risk-free yield curves in dollars and euros. This, arithmetically, means that the difference in yield between the Ukrainian issue in dollars and the Ukrainian issue in the euro is compared with the difference between the rates for the US Treasuries and the German bonds.
For seven-years bonds, the bet difference between risk-free bonds is 220 bp. The difference in such rates is approximately equivalent to the price of a swap – the transition from one currency to another, therefore, in liquid markets, there is approximately the same difference between the yield of securities in euros and dollars.
That is, the spread of the dollar issue to US treasury bonds should be equal to the spread in euros to bonds of Germany. For Ukraine, this would mean that the corresponding yield would be 5.87% per annum.
However, this difference varies in the real market in the segment where “junk” bonds are traded. The spread of the Ukrainian seven-year issue in dollars above the US curve on the date of placement was 592 b.p. and the spread of the euro in the German curve was 711 bp on the date of release of the issue -whider than one in USD.
The same situation is typical of other securities on the market: spreads for other “junk” bonds (Argentina, Egypt, Côte d’Ivoire, Senegal) in the euro are also wider
If the two issues coincide maturities, then the operation of comparing their spreads (issue yield minus the yield of risk-free securities of two countries in different currencies) can be simplified to compare the direct difference in yields for bonds of two countries in euros and dollars.
This is exactly the case with Ukraine with Egypt: both issuers have a wide range of eurobonds in dollars and seven-year issues in dollars and euros. The difference between the yields of both issues in euros and dollars is almost identical. In addition, the Ukrainian premium over Egypt in dollars and the corresponding premium in euro are almost the same.
Table 2. Conditions for the seven-year bond issue by Ukraine and Egypt ( as of June 13)
| Revenue in dollars | Revenue in euros | Difference between bond rates in dollars and euros, bps. | |
| Ukraine | 8,07% | 6,75% | (8,07-6,75)*100=132 |
| Egypt | 6,48%* | 5,15% | (6,50-5,15)*100=133 |
| Ukraine premium above Turkey, bp. | (8,07-6,48)*100=159 | (6,75-5,51)*100=160 |
*Synthetic paper corresponding to a 7-year life span
Source: Cbonds
If to compare Ukraine and Turkey (BB rating), the difference between the yield in dollars and euro for Ukraine by 23 points is less than for Turkey, for the euro issue (table 3).
Table 3: Some terms and conditions of the seven-year Eurobonds issued by Ukraine and Turkey (as of June 13)
| Yield, USD | Yield, Euro | Difference, bp. | |
| Ukraine-26 | 8.07 | 6.75 | 132 |
| Тyrkey-26 | 7.334 | 5.78 | 155 |
| Ukrainian premium above Turkey bp. | 74 | 97 |
Source: Cbonds
After placing Ukrainian eurobonds almost immediately increased significantly in price. Already the next day it was 102% of the nominal value, yield dropped to 6.4% per annum. This means that the government paid 35 bp more during placement, than the market assessed this security the next day.
In the week after placement, the price of securities increased to 104.25% of the nominal value, while yields fell to 5.99% per annum (by 76 bp. lower than when placed), the yield of dollar seven-year Eurobonds also fell from 8.07% to 13 June to 7.59% as of June 20 – 48 bp .
Table 4. Dynamics of yields and spreads of Ukrainian bonds one week after placement
| Yield for seve-years securities | At the placement | Week after placement | ||||||
| During the placement of Ukraine | One week after placement | Yield(BID) | Spread to risk-free securities | Yield(BID) | Spread to risk-free securities | |||
| USA | 1,96 | 1,93 | Ukraine(USD) | 8,07 | 611 | 7,59 | 566 | |
| Germany | -0,496 | -0,559 | Ukraine(euro) | 6,75 | 724,6 | 5,99 | 654,9 | |
| Spread difference | 113,6 | 88,9 | ||||||
Source: Dragon Capital, treasury.gov, worldgovernmentbonds.com
On the one hand, this is bad, because the government “overpay”, on the other – it creates positive expectations for subsequent issues, and it will be easier for Ukraine to place new bonds.
Sharp movements are characteristic of emerging markets, but this, both in the euro and in dollars, shows a great deal of positive attitude to Ukraine after its placement – both on the wave of interest in the issue and due to the fact that Ukraine, having attracted funds, reduced the risk of refinancing its own debt and improved its macroeconomic situation.
The question of whether such positive developments were worth overpaying, whether it would be possible to attract new funds and save on interest rates in the future, can be answered when Ukraine comes out with a new placement.
Conclusions and recommendations
In a short-term, Ukraine, to avoid troubles in the debt market, should better not to make emergency private placements to overcome cash disruptions. Examples of such unsuccessful steps are the additional placement of bonds in March 2019 and private bridge financing in August 2018, which the market dubbed “loan to payroll.”
This is quite possible due to the timely implementation of structural reforms in accordance with agreements with the IMF and other institutional lenders. (This will mean timely receipt of tranches and the possibility for the Ministry of Finance to go with market placements in advance.)
In the long run, in order to borrow on more favorable terms, Ukraine should build closer relations with investors – so it will better feel the mood of the market. Also, she needs to raise her credit rating.
If Ukraine had a BB rating (Georgia, Guatemala, Serbia, Turkey, Vietnam), it could borrow in dollars by 2.5% cheaper than it is now.
For this, it is necessary to extend the rule of law in Ukraine and strengthen institutions. This will allow attracting new investments and bringing a significant part of the economy out of the shadows.
As a result, the country will get stronger economic growth, which will reduce the riskiness of the state and increase its credit rating.
The prospects for the credit rating for 2020 are positively restrained. If Ukraine succeeds in tests with peak repayment of debts, parliamentary elections, the formation of a coalition government and the resumption of relations with the IMF, the rating outlook may increase.
If, however, the immediate political or personal benefits of the politicians will outweigh the long-term benefits for the state and the decisions taken will undermine macroeconomic stability, Ukraine risks remaining “junk” status for a long time.
Annotations
- https://ua.interfax.com.ua/news/economic/572634.html
- https://www.ise.ie/debt_documents/Prospectus%20-%20Standalone_9ec0329c-ca4b-46f2-8d6d-1e36aa198b37.PDF
- https://www.ise.ie/debt_documents/Prospectus%20-%20Standalone_9ec0329c-ca4b-46f2-8d6d-1e36aa198b37.PDF
- https://www.ise.ie/debt_documents/Prospectus%20-%20Standalone_ca777a88-a124-4ed8-b370-721a4056dddc.PDF
- Spread is the difference between the interest rates on securities with the same maturity, the unit of measurement 1 basis point = 0,01 percentage point. Typically, USCs position themselves as the least risky securities, and the rate for them – as risk-free. Spread on securities of other countries in the USC depends on their riskiness. The greater the risk, the wider the spread. The fluctuation of the same rate on US bonds is an indicator of the market price of money, which varies depending on various factors. The risk of a country other than the United States does not affect it.
- In total, in 2018 and the first quarter of 2019, 26 developing countries made 39 placements of dollar bonds for 10 years.
- We used rating agencies from Fitch for analysis. In addition to it, there are also world-renowned S & P and Moody’s ratings. Other indicators we used to analyze instead of the rating are GDP per capita, slippery average inflation for 2015-2017, volatility of the national currency rate for the povroke to placement and the ratio of government debt to GDP. According to them, the correlation is much weaker than the integral indicator.
- To construct a curve, we used a quadratic function, since it is better than the linear description of the data. At the same time, increasing the degree to the 3rd does not give statistically significant coefficients. So we stopped at the 2nd degree
- On the data described in Figure 1, we took the median, median and trend-calculated values for the ratings B and B-, we calculated in each case the difference – the premium for one rating step – and the averaged indicator. We got 152 bp


Attention
The authors do not work for, consult to, own shares in or receive funding from any company or organization that would benefit from this article, and have no relevant affiliations