We analyzed data from Twitter about the recent firing of Mr. Borovik in the two weeks following the event, from May 13 – May 30. Among the accounts with a high number of followers, media tends to be neutral or positive about Borovik, while individual accounts (opinion makers) tend to be negative. There is no discernible dynamic pattern in the data that is consistent with an organized campaign in favor or against Borovik. The first part of the research is here.
FACT 1. The top 10 sources of retweets included 4 media outlets and 6 individual accounts.
FACT 2. Media accounts generate the majority of neutral and positive tweets among top 10 sources of respective retweets.
FACT 3. Individual accounts generate the majority of negative tweets among top 10 sources of negative retweets.
Table 1 shows the top-10 sources that were retweeted regarding Mr. Borovik.
These accounts represent very different sources. Some of them are known and very well established media sources like @ukrpravda_news. Some of them are actually individuals (opinion leaders like) like @pharaon01 or @ryabtchuk_roman. And some of them are anonymous projects created for entertainment and pranking like @Hy_Donetsk. Surprisingly, notorious Russian philosopher Dugin appeared to be on the list meaning that some part of the discussion about Mr. Borovik belongs to the Russian segment of Internet.
Tables 2 to 4 show which accounts spread mostly positive, negative, or neutral messages. The negative sentiment was spread mostly by bloggers and opinion makers, whereas news-media were mostly responsible for positive and neutral messages. Red means that a Twitter account is the news-media, blue means that a Twitter account is an individual/blogger, and brown means that an account provides an official point of view (governmental body, or a blogger affiliated with state).
Table 1. Top-10 retweeted sources in the data
| Name of the account | Amount of re-tweets from this account | Amount of followers |
| @ukrpravda_news | 115 | 564,534 |
| @pharaon01 | 61 | 12,873 |
| @platfor_ma | 53 | 3,467 |
| @ryabtchuk_roman | 48 | 4,378 |
| @RidusNews | 44 | 51,578 |
| @Serglvivua | 36 | 7,628 |
| @Gordonuacom | 34 | 2,072 |
| @A_G_Dugin | 27 | 23,457 |
| @Hy_Donetsk | 27 | 37,492 |
| @Smeritchka | 27 | 1,573 |
Source: Authors calculation
Table 2. Top-10 sources of the retweeted negative messages
| Sources | Frequency | Amount of followers |
| @pharaon01 | 54 | 12,873 |
| @A_G_Dugin | 27 | 23,457 |
| @Smeritchka | 26 | 1,573 |
| @ryabtchuk_roman | 21 | 4,378 |
| @Serglvivua | 17 | 7,628 |
| @PaulKnorr2008 | 14 | 2,014 |
| @DZHIGURDA12 | 12 | 58,678 |
| @antikorua | 11 | 5,991 |
| @by_vanyaDJ | 10 | 8,063 |
| @eldarmurtazin | 10 | 52,557 |
Source: Authors calculation
Table 3. Top-10 sources of the retweeted positive messages
| Sources | Frequency | Amount of followers |
| @RidusNews | 38 | 51,578 |
| @Gordonuacom | 24 | 2,072 |
| @ukrpravda_news | 21 | 564,534 |
| @dd81927 | 19 | 702 |
| @Serglvivua | 18 | 7,628 |
| @Banderovka | 17 | 3,228 |
| @ryabtchuk_roman | 13 | 4,378 |
| @soulstray | 13 | 3,477 |
| @ukrfootball | 12 | 5,468 |
| @Mr_1nside | 11 | 1,623 |
Source: Authors calculation
Table 4. Top-10 sources of the retweeted neutral messages
| Sources | Frequency | Amount of followers |
| @ukrpravda_news | 91 | 564,534 |
| @platfor_ma | 53 | 3,467 |
| @Hy_Donetsk | 22 | 37,492 |
| @zackforex | 21 | 19,293 |
| @EuroMaydan | 19 | 289,880 |
| @epravda | 17 | 2,463 |
| @dw_ukrainian | 16 | 29,798 |
| @ryabtchuk_roman | 14 | 4,378 |
| @AndreyBasevich | 13 | 1,083 |
| @ArtemZeleny | 13 | 9,643 |
Source: Authors calculation
Dynamics of retweeting
Fact 4. Media picks up the issue, opinion makers follow, public responds, discussion dies. Three waves.
An evolution of retweeting can be seen in Figure 1 that shows a dynamic change in the connections between twitter accounts and twitter sources. Each dot on Figure 5 is an account and a line (edge) is a connection between them when a retweet is performed. The changes per day are revealed. Some dots are larger because they have more connections.
To simplify the understanding of what is going on there, think about this visualization in the following way. In the left upper side of the figure you may see big dots, they are important sources (like @ukrpravda_news). At the very beginning on May 14, you may see that there were not so many connections and almost all of them were to the important media sources. However, later the connections are more bizarre and dense. This means that after the first wave of the information spread (media spread), a new wave of people sharing each other tweets occurred than this wave decreases. Then around May 23 and May 27 the situation repeats over and over again. First people react to media, then there is a great deal of bizarre spread across connections, and then calm.
Figure 1. The evolution of retweets in three steps from 14th till 30th of May. Media and opinion leaders serve as sources; people pick up the subject; calm.
Source: Authors calculation, YouScan Data
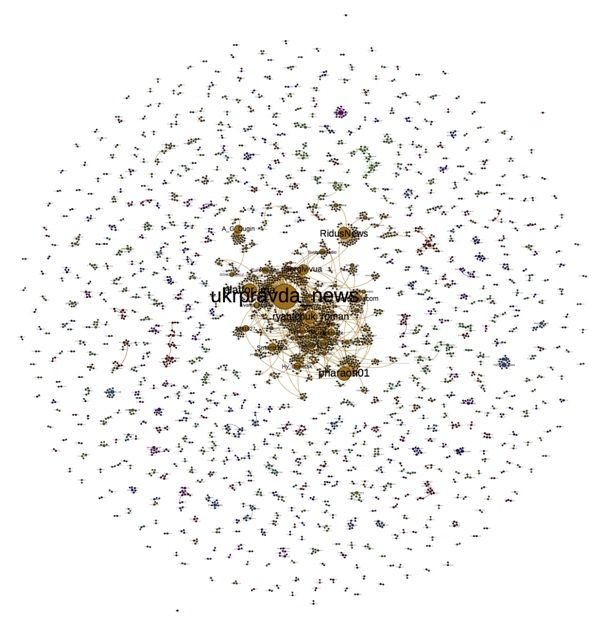
Fact 5. There are numerous small isolated clusters of retweets. Thus, there is no common knowledge of distribution of opinions.
Figure 2 reveals the network of retweets. This time the overall data without dynamic changes are captured in one visualization. It shows important informational sources and the links between them in the middle of the image. For instance, many readers are connected by @ukrpravda_news and @pharaon01 by sharing their information. However, it is also evident that there are a lot of users who are disconnected from these major sources and are connected to each other in small clusters of friendships. These connections are the sources of chaotic edges appearance and disappearance on the previous dynamic visualization
Figure 2. Network visualization of re-tweets in the data
Source: Authors calculation
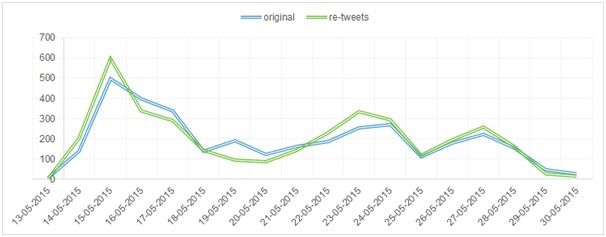
Fact 6. The intensity of retweets is correlated with the intensity of the original tweets.
We compare original messages and retweets. As Figure 3 suggests the amount of retweets was highest on May 14, May 22-24, and May 27. These are the days when the most important news about Borovik was debated (his dismissal or controversial interviews about the KGB affiliation). Thus, the public got involved into the case of Borovik mostly by means of diffusion (retweets) through opinion leaders and media sources during several critical days.
Figure 3. Original messages and retweets about Borovik per day. Retweets of media dominated after news and then converged
Source: YouScan, Authors calculation
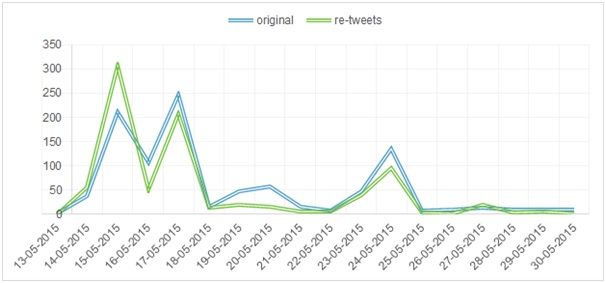
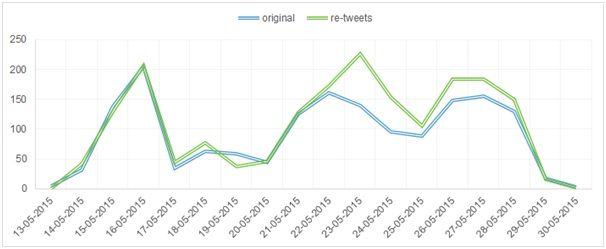
Figures 4 and 5 elaborate on this point by presenting positive and negative distributions respectively. Interestingly, the majority of negative messages starting from May 22 were retweeted from the same sources. By contrast, positive messages about Borovik were often expressed in original posts.
These figures reveal an interesting dynamic in how the Ukrainian public engaged in the debate about Mr. Borovik. Messages with negative sentiment are spread from known and connected sources (e.g., accounts of official media). However, positive reactions expressed individually are not likely to be retweeted, maybe due to the low levels of online embeddedness among ordinary Ukrainians.
These observations give support to the conclusion that opinion makers, and some media, suggested negative narrative, whereas majority of the public held positive sentiment.
Figure 4. Positive original messages and retweets about Borovik per day. Positive messages retweeting prevails at the beginning after news are shared, but after that original messages dominate
Source: YouScan, Authors calculation
Figure 5. Negative original messages and retweets about Borovik per day. Retweets and original negative expressions converged at the beginning. An increase of negative retweets after May 21
Source: YouScan, Authors calculation