While social trust is seen as an essential factor for political, economic, and social progress globally, its country-specific mode of formation remains under-researched. This study attempts to define major predictors that contribute to yielding or undermining trust in the peculiar context of Ukraine. I demonstrate that the process of social trust emergence is primarily influenced by political conditions in Ukraine and is closely linked to the issues of ethnic identity and liberal democracy.
Research recognizes the critical role of social trust at individual and societal levels. Social trust promotes economic growth, raises the quality of democracy, and contributes to institutional stability in a country. While acting as a foundation for cooperation, trust enables social inclusion and fosters social cohesion. Given the importance of social trust, it is not surprising that many studies attempt to define its factors and mechanisms of formation. Despite the significant controversy around this issue, scholars generally agree that the process of trust emergence is often a country-specific phenomenon. Determinants that can be crucial for one country may be insignificant in the context of another.
This study focuses on Ukraine and pursues a two-fold objective. On the one hand, it struggles to define a complete stock of the micro- and macro-factors that shape social trust emergence in Ukrainian society. The primary focus is on examining the impact of the diverse and dynamic contextual factors on trust levels among the local population. On the other hand, it attempts to expand the conventional analysis by separating the pre-war from the in-war period and exploring a change in the pattern of social trust formation caused by the ongoing conflict.
Data and method
Ukrainian society can be characterized as fairly trusting, with around 30 percent of respondents declaring that they can trust others. Moreover, the trust level is rising: the proportion of the trusting population increased from 25 percent in 2011 to 31 percent in 2020. To unpack determinants of social trust in Ukraine, I apply logistic regression to the data from the two most recent waves (2011 and 2020) of the World Values Survey. The analysis involves a two-step procedure. I first look at the pooled data for both 2011 and 2020 and then separately for each year. Many studies have demonstrated that pooling can result in a loss of sensitivity and an increase in false positives that can significantly alter the interpretation of results (Zar, 1999). In the case of Ukraine, this difference means the existence of a wide variability between the two subsamples, most probably due to the beginning of the war in 2014. I expect that the war has caused a path-break in the mode of social trust formation, significantly changing how many dispositional and contextual factors influence trust levels in Ukraine.
The dependent variable is social trust which takes the value of 1 if the respondents believe that “most people can be trusted” and the value of 0 if they think that “you need to be careful when dealing with people.”
The key independent variables are operationalizations of the political context and values that include a respondent’s evaluation of democracy in Ukraine on a 10-point scale from 0 “not at all democratic” to 1 “completely democratic”; the choice of ethnic group one feels to belong; language spoken at home, and the level of pride one feels for Ukraine. In addition, I include liberal values captured by the extent to which respondents support income inequality (measured from 1 “incomes should be made more equal” to 10 “we need larger income differences as incentives”), competition (measured from 1 “competition is good” to 10 “competition is harmful”), self-reliance (measured from 1“people should take more responsibility” to 10 “the government should be made more responsible”), and the importance of democracy (measured from 1 “democracy is not at all important for society” to 10 “democracy is absolutely important”). The four variables are rescaled to change on a ten-point scale between 0 and 1.
I also control for several personal characteristics, such as being religious (proxied by the frequency of church attendance); belonging to a specific religious denomination or being an atheist; evaluating one’s health as good or bad; feeling happy or not; feeling secure in one’s neighborhood or not; being satisfied with one’s income (on a 10-point scale); living in a specific region of Ukraine; being born in Ukraine or another country, and a respondent’s age. Table A1 in the Annex summarizes the descriptive statistics for the key variables used in the analysis. Table A3 furnishes a correlation matrix for the key variables, demonstrating the lack of a strong correlation between any of the selected factors and excluding any problem of multicollinearity.
I test the following hypotheses:
- Is social trust related to the perceived quality of democracy in Ukraine?
- Are people who identify themselves as Ukrainians or have a stronger sense of national pride more likely to trust other individuals?
- Can the choice of the language spoken at home influence trust levels?
- Could the recent conflict in the East of Ukraine increase social trust by uniting the population against external aggression?
- Are people with more liberal values likely to trust others more?
Empirical results
Model 1 (see Figure 1 and Table A2 in the Annex) furnishes empirical evidence from the pooled dataset suggesting that dispositional factors significantly influence social trust levels in Ukraine.
Figure 1. Estimation results for the pooled sample: full effects
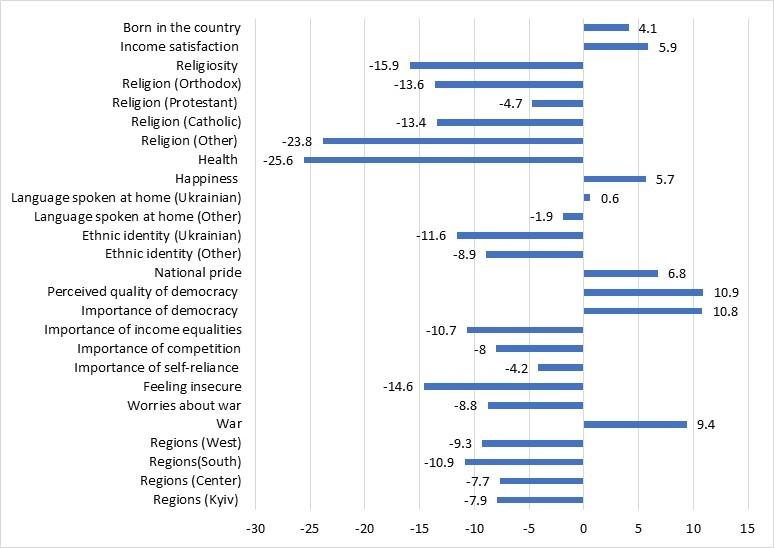
Note: Because logit coefficients do not facilitate straightforward interpretation, I report the estimated effects of each factor on social trust in terms of full effects. A full effect is the average marginal effect when all variables are scaled from 0 to 1. More specifically, it is the average change in the individual’s likelihood of trusting others, when one raises a given factor from its minimum to its maximum value in the dataset while keeping other variables constant. Full effects express a clear idea of the full range of variation that a given variable is found to produce in a manner that facilitates comparison with other variable’s effects, thus making them expedient for reporting results and discussing implications.
Social trust increases with religiosity but is also high among Atheists. Solid religious beliefs create an ethos of trust in Ukraine, which is commensurate with the existing findings established for European and non-European societies (Branas-Garza et al., 2006; Van Oorschot and Arts, 2005). Atheists are believed to have stronger feelings of empathy and compassion for others than religious individuals, especially when their religions are hierarchical or include the practice of absolution. Religious people adopt more prosocial behavior only when they have higher levels of religiosity while grounding their prosociality less in emotion, and more in other factors such as doctrine, a communal identity, or a sense of moral obligation (Saslow et al., 2013). Figure 1 and Table A2 demonstrate that the Orthodox and, to some extent, Catholics have less trust in others than Atheists. Both religious denominations believe it is possible to absolve one’s sins by the church. The practice of absolution releases the subjects of the Pope of individual responsibility for their worst deeds, which could lead people to be more wary of trusting their fellow citizens (Uslaner, 2002).
In line with the existing research, the respondent’s health condition has an adverse effect on the probability of trusting people (Van Oorschot and Arts, 2005). The lack of adequate state support in the case of illness or disability can explain the health variable’s strong negative impact on trust scores in the case of Ukraine. Szreter (2002) explains that if the government guarantees to keep an individual alive and in good health when he or she is in difficulty, the individual does not feel abandoned but integrated. As a result, his perception of failing substantially decreases. This creates the basis for high evaluations of the government and affects, first and foremost, an individual’s trust in state institutions. High regard for the state and its activities, in turn, forms the essential cultural, symbolic, psychological, and experiential preconditions for citizens to respect and trust each other. (Szreter, 2002).
Expectedly, being generally happier is associated with higher levels of trust, which is commensurate with the positive association that life satisfaction or happiness levels have been found to develop to generalized trust (Bai et al., 2019)
Surprisingly, those who identify themselves as Ukrainians trust less than those who identify themselves as Russians (belonging to another ethnic group has no effect). At the same time, the sense of pride for Ukraine yields more individual trust, regardless of the ethnic identity held by the respondents. Language spoken at home has no impact on social confidence. These results are in line with Onuch and Hale (2018). They argue that in the case of Ukraine, one needs to distinguish between language-related identity (ethnolinguistic identity, language embeddedness, and individual language preference) and nationality since there is a wide variation in the way these factors impact various political, economic, and social attitudes among the local population. Table A2 shows that the language spoken by the respondent at home is not a predictor of social trust, while the nation one identifies with can influence trust levels. Logically, faith requires bonds among individuals while language doesn’t shape these bonds in Ukraine. Instead, the feeling of belonging to the Ukrainian nation tends to be more critical to bonding with others. Furthermore, Russia’s aggression promoted a further detachment of language use from national identity. Many Russian speakers came to identify strongly with the Ukrainian nation without abandoning their accustomed language or adding Ukrainian as an active part of their communicative repertoire (Aliyev, 2019).
Expectedly, people who think Ukraine is more democratic have higher confidence in others. Democracy is believed to increase fairness and justice, promoting social trust formation (Rothstein and Stolle, 2010). In addition, democratic systems can institutionalize distrust by providing many opportunities for citizens to feel included and empowered (Warren 1999). Conversely, the importance of democracy as a form of governance only has a marginal impact on trust. Nonetheless, high trust levels characterize the individuals adhering to more liberal values. Those against competition and in favor of significant income inequalities tend to trust others less.
The low confidence that Ukrainians have in the police and courts, along with the poor quality of their services, can explain an antagonistic relationship that feeling insecure develops to social trust in society. Also, people who worry about the ongoing war in Ukraine have significantly less confidence in others since conflicts can increase personal insecurities and the danger of losses. At the same time, the coefficient on the war variable shows that social trust has increased after the outbreak of the war (2020 compared to 2011). Ethnic wars can yield more trust in society via the state’s discourse on the collective threat that unites the population against a common aggressor (Rohner et al., 2013). Somewhat surprising is that Eastern regions of Ukraine have higher trust levels than Kyiv, Western, Southern, or Central areas.
A lot of change in the country over the analyzed period justifies the need to analyze social trust models for each year separately (see Figure 2, Model 2 and Model 3 in Table A2). The juxtaposition of waves suggests an increase in the impact of religiosity and religion on trust levels in 2020. Similarly, the adverse effects of poor health were more substantial in 2020 than 2011. Language fractionalization did not relate to trust in any of the selected periods, while ethnic fractionalization commenced reducing confidence in 2020. National pride was necessary for trust-building in 2011 but showed no relation to trust more recently. The actual quality of democracy was a more positive determinant of confidence in 2011 than in 2020. Instead, social trust became more sensitive to the extent of importance that the Ukrainian population assigns to democracy as a form of governance in their country lately.
Figure 2. Estimation results for 2020 and 2011 separately: full effects
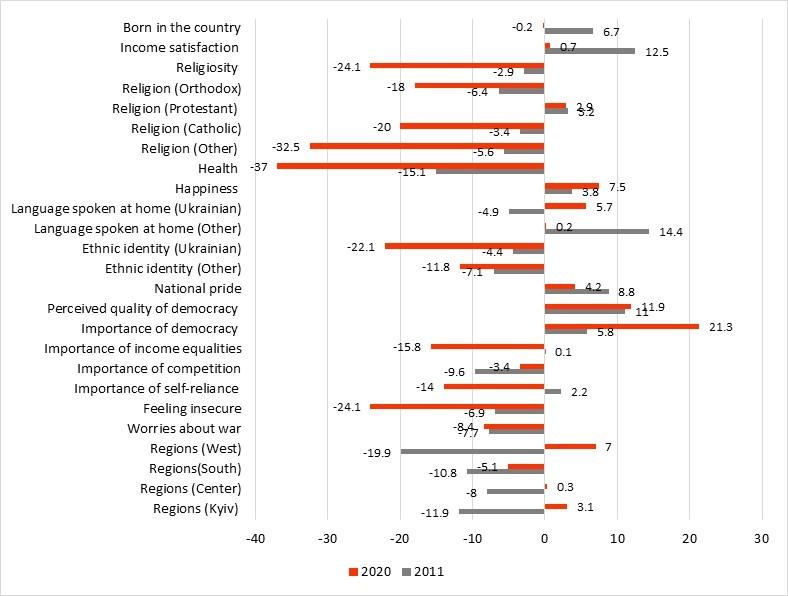
The time also reduced competition’s influence on trust scores while bringing forward the issue of self-reliance and income inequality. Lower trust levels characterized individuals who legitimize income inequality and believe that the state and not individuals should take more responsibility. The negative impact of insecurity increased in 2020 compared to 2011, while the effects of war expectations followed a reverse trend. Worries about the war undermined social trust in 2011 but appeared to be a neutral factor in 2020.
Interesting is also a decline in regional differences in social trust. If the East appeared as very different from other regions in 2011, these differences did not re-appear in the sample of 2020 suggesting that Ukrainians became more alike across regions. The war neutralized the regional differences by uniting the people’s visions, aspirations, and expectations. In addition, the rise of patriotism, as well as the internal migration caused by the war, have contributed to smoothening regional variations in trust scores recently.
Overall, social trust formation patterns underwent a profound change in Ukraine in the aftermath of the Russian aggression that impacted not only the country’s economic and political systems but also its society. On the one hand, the war has terminated the impact of conventional determinants of trust, such as democracy and national pride. Instead, the ongoing war has brought forward the issues of security and liberal democratic values, making them decisive factors in the trust-building process. In addition, the war demonstrated the government’s inability to handle the conflict and the indifference of the world toward Ukraine, which all in all made Ukrainian people turn to God and increased the role of the religion-related factors in social trust formation processes.
Conclusion and discussion
My analysis provides an exciting insight into the mechanisms of social trust formation in Ukraine that can be useful for the country’s policy-making at least in the two main directions.
First, social trust appeared to be strongly determined by politics in Ukraine. Building democracy can increase the bonds in society. People’s trust in others may rise not only because their country becomes richer but also because it makes significant progress in building a democratic state where everyone can have a say and influence events.
Second, while producing multiple adverse effects on the national economy and society, the recent conflict in the East of Ukraine raised social trust levels by uniting the population against a common aggressor. In addition, the war has caused a path-break in the pattern of social trust formation by increasing the influence of many dispositional determinants that were previously classified as unimportant and strengthening the role of political and economic attitudinal variables. In particular, policy-makers should turn to the issues of ethnic identity and liberal values as possible instruments of enhancing the bonds among the individuals in Ukrainian society.
References
Aliyev, H. (2019), “The logic of ethnic responsibility and progovernment mobilization in East Ukraine conflict,” Comparative Political Studies, 52(8), 1200–1231, DOI: https://doi.org/10.1177/0010414019830730.
Bai, C., Gong, Y., & Feng, C. (2019), “Social Trust, Pattern of Difference, and Subjective Well-Being,” SAGE Open. DOI: https://doi.org/10.1177/2158244019865765.
Branas-Garza, P., Rossi, M. and Zaclicever, D. (2006), “Individual’s religiosity enhances trust: Latin American evidence for the puzzle,” DECON Working Paper, No. 05/06, 25 p.
Onuch, O. and Hale, H. (2018), “Capturing ethnicity: the case of Ukraine,” Post-Soviet Affairs, 34(2-3), 84-106, DOI: https://doi.org/10.1080/1060586X.2018.1452247.
Rothstein, B. and Stolle, D. (2010), “The state and social capital: An institutional theory of generalized trust.” In: Kesselman M. (ed.) Readings in Comparative Politics: Political Challenges and Changing Agendas. Boston, Wadsworth Cengage Learning, pp. 123–128.
Saslow, L. R., Willer, R., Feinberg, M., Piff, P. K., Clark, K., Keltner, D., & Saturn, S. R. (2013), My Brother’s Keeper?: Compassion Predicts Generosity More Among Less Religious Individuals. Social Psychological and Personality Science, 4(1), 31–38. https://doi.org/10.1177/1948550612444137
Szreter, S. (2002), “The state of social capital: bringing back in power, politics, and history,” Theory and Society, 31(5), 573 – 621, DOI: https://www.jstor.org/stable/3108542.
Thoenig, R. M. and Zilibotti, F. (2013) “Seeds of Distrust: Conflict in Uganda. Journal of Economic Growth 18, no. 3 (2013): 217–52, http://www.jstor.org/stable/42635325.
Triandis, H. C. (1995), Individualism and Collectivism. Westview Press.
Uslaner, E. (2002), The moral foundations of trust. Cambridge: Cambridge University Press.
Van Oorschot, W., and Arts, W. (2005), “The social capital of European welfare states: The crowding-out hypothesis revisited,” Journal of European Social Policy, 15(1), 5 – 26,l DOI: https://doi.org/10.1177/0958928705049159.
Warren M.E. (1999), Democracy and Trust. Cambridge: Cambridge University Press.
Whiteley, P. (1999), “The origins of social capital,” In Jan van Deth, Marco Maraffi, Ken Newton and Paul Whiteley (eds) Social Capital and European Democracy, London: Routledge, pp. 25 – 44.
Zar, J.H. (1999), Biostatistical Analysis, 4th Edition, Northern Illinois University.
Annex
Table A1. Descriptive statistics for the key variables included in the analysis
| VARIABLES | Mean | St. dev. | Min. | Max. |
| Social Trust | 0.276 | 0.447 | 0 | 1 |
| Born in the Country | 0.930 | 0.255 | 0 | 1 |
| Age | 47.389 | 17.467 | 18 | 89 |
| Income Satisfaction | 0.474 | 0.238 | 0 | 1 |
| Religiosity | 0.446 | 2.039 | 0 | 1 |
| Religion Types | ||||
| Atheist | 0.088 | 0.284 | 0 | 1 |
| Roman Catholic | 0.071 | 0.070 | 0 | 1 |
| Protestant | 0.013 | 0.114 | 0 | 1 |
| Orthodox (Russian, Greek, etc.) | 0.693 | 0.461 | 0 | 1 |
| Other Religions | 0.037 | 0.188 | 0 | 1 |
| Do not know | 0.045 | 0.208 | 0 | 1 |
| No answer | 0.053 | 0.223 | 0 | 1 |
| Health | 0.539 | 0.167 | 0 | 1 |
| Happiness | 0.756 | 0.429 | 0 | 1 |
| Language Group | ||||
| Ukrainians | 0.450 | 0.329 | 0 | 1 |
| Russians | 0.545 | 0.498 | 0 | 1 |
| Other | 0.015 | 0.123 | 0 | 1 |
| Ethnic Group | ||||
| Ukrainians | 0.884 | 0.458 | 0 | 1 |
| Russians | 0.093 | 0.290 | 0 | 1 |
| Other | 0.023 | 0.150 | 0 | 1 |
| National Pride | 0.782 | 0.413 | 0 | 1 |
| Democracy Evaluation | 0.475 | 0.248 | 0 | 1 |
| Democratic and Liberal Values | ||||
| Importance of Democracy | 0.800 | 0.227 | 0 | 1 |
| Income Inequality | 0.469 | 0.293 | 0 | 1 |
| Importance of Competition | 0.432 | 0.268 | 0 | 1 |
| Preference for Self-reliance | 0.734 | 0.272 | 0 | 1 |
| Insecurity Perception | 2.081 | 0.710 | 1 | 4 |
| Worries about War | 0.805 | 0.396 | 0 | 1 |
| Region Groups | ||||
| East | 0.175 | 0.379 | 0 | 1 |
| West | 0.236 | 0.424 | 0 | 1 |
| South | 0.252 | 0.435 | 0 | 1 |
| Center | 0.224 | 0.417 | 0 | 1 |
| Kyiv | 0.113 | 0.316 | 0 | 1 |
Table A2. Critical Determinants of Social Trust Formation in Ukraine
| Model 1 | Model 2 | Model 3 | ||
| VARIABLES | Pooled Sample | 2011 | 2020 | |
| Born in the Country | 0.213 | 0.371 | -0.013 | |
| (0.256) | (0.319) | (0.450) | ||
| Age | 0.003 | 0.005 | 0.003 | |
| (0.003) | (0.005) | (0.006) | ||
| Income Satisfaction | 0.306 | 0.693** | 0.038 | |
| (0.247) | (0.329) | (0.408) | ||
| Religiosity | -0.823*** | -0.162 | -1.231*** | |
| (0.239) | (0.336) | (0.356) | ||
| Religion Types | ||||
| Atheist | Ref. category | Ref. category | Ref. category | |
| Roman Catholic | -0.689** | -0.193 | -1.028** | |
| (0.279) | (0.387) | (0.516) | ||
| Protestant | -0.244 | 0.179 | 0.149 | |
| (0.439) | (0.512) | (0.964) | ||
| Orthodox (Russian, Greek, etc.) | -0.699*** | -0.356 | -0.923** | |
| (0.192) | (0.223) | (0.432) | ||
| Other Religions | -1.225*** | -0.311 | -1.666*** | |
| (0.377) | (0.572) | (0.604) | ||
| Do not know | -0.779** | Not applicable | -0.665 | |
| (0.333) | (0.499) | |||
| No answer | -0.461 | Not applicable | -0.779* | |
| (0.285) | (0.473) | |||
| Health | -1.317*** | -0.834 | -1.892*** | |
| (0.382) | (0.543) | (0.577) | ||
| Happiness | 0.298** | 0.212 | 0.317 | |
| (0.140) | (0.180) | (0.242) | ||
| Language Group | ||||
| Russian | Ref. category | Ref. category | Ref. category | |
| Ukrainian | 0.031 | -0.274 | 0.294 | |
| (0.139) | (0.180) | (0.234) | ||
| Other Languages | -0.096 | 0.801 | 0.000 | |
| (0.521) | (0.624) | (0.011) | ||
| Ethnic Group | ||||
| Russian | Ref. category | Ref. category | Ref. category | |
| Ukrainian | -0.595*** | -0.245 | -1.128*** | |
| (0.224) | (0.266) | (0.439) | ||
| Other Nation | -0.462 | -0.398 | -0.606 | |
| (0.457) | (0.544) | (0.925) | ||
| National Pride | 0.351** | 0.487*** | 0.216 | |
| (0.139) | (0.173) | (0.251) | ||
| Democracy Evaluation | 0.566*** | 0.611** | 0.610* | |
| (0.210) | (0.303) | (0.318) | ||
| Democratic and Liberal Values | ||||
| Importance of Democracy | 0.568** | 0.320 | 1.095*** | |
| (0.248) | (0.319) | (0. 419) | ||
| Income Inequality | -0.549*** | 0.001 | -0.812*** | |
| (0.209) | (0.294) | (0.316) | ||
| Importance of Competition | -0.413** | -0.532** | -0.176 | |
| (0.198) | (0.269) | (0.324) | ||
| Preference for Self-reliance | -0.216 | 0.122 | -0.720** | |
| (0.201) | (0.291) | (0.306) | ||
| Insecurity Perception | -0.750** | -0.385 | -1.234*** | |
| (0.299) | (0.409) | (0.476) | ||
| Worries about War | -0.455*** | -0.426*** | -0.432 | |
| (0.134) | (0.154) | (0.302) | ||
| War | 0.489*** | Not applicable | Not applicable | |
| (0.131) | ||||
| Region Groups | ||||
| East | Ref. category | Ref. category | Ref. category | |
| West | -0.479** | -1.103*** | 0.360 | |
| (0.201) | (0.275) | (0.365) | ||
| South | -0.571*** | -0.597*** | -0.264 | |
| (0.163) | (0.202) | (0.310) | ||
| Center | -0.395** | -0.447* | 0.018 | |
| (0.181) | (0.230) | (0.340) | ||
| Kyiv | -0.410** | -0.665** | 0.161 | |
| (0.197) | (0.272) | (0.346) | ||
| Constant | 1.164** | -0.647 | 2.815*** | |
| (0.575) | (0.751) | (1.083) | ||
| Observations | 2,084 | 1,138 | 938 |
Source: Author’s calculations using the WVS (2011 and 2020).
Notes: Standard errors in parentheses.
*** p<0.01, ** p<0.05, * p<0.1.
Table A3. Correlations among Key Determinants of Social Trust
| Social trust | Born in the Country | Age | Incomer Satisfaction | Religiosity | Roman Catholic | Protestant | Orthodox | Other Religions | Atheist | |
| Social trust | 1 | |||||||||
| Born in the Country | 0.020 | 1 | ||||||||
| Age | -0.039 | -0.160*** | 1 | |||||||
| Income Satisfaction | 0.093*** | 0.042 | -0.243*** | 1 | ||||||
| Religiosity | -0.065** | -0.081*** | -0.047* | 0.018 | 1 | |||||
| Roman Catholic | 0.022 | 0.042 | -0.013 | 0.005 | -0.212*** | 1 | ||||
| Protestant | 0.018 | -0.007 | 0.001 | 0.031 | -0.068** | -0.033 | 1 | |||
| Orthodox | -0.046* | 0.010 | 0.051* | -0.014 | -0.160*** | -0.436*** | -0.189*** | 1 | ||
| Other Religions | -0.039 | -0.077*** | 0.011 | 0.030 | 0.009 | -0.050* | -0.021 | -0.283*** | 1 | |
| Atheist | 0.037 | -0.032 | -0.011 | -0.024 | 0.337*** | -0.085*** | -0.037 | -0.480*** | -0.055* | 1 |
| Health | -0.125*** | -0.048* | 0.503*** | -0.354*** | -0.018 | -0.023 | -0.021 | 0.088*** | -0.002 | -0.000 |
| Happiness | 0.110*** | 0.039 | -0.198*** | 0.333*** | -0.056* | 0.029 | -0.000 | -0.011 | -0.017 | -0.046* |
| Speak Ukrainian | 0.019 | 0.219*** | 0.052* | -0.026 | -0.204*** | 0.198*** | -0.026 | 0.039 | -0.083*** | -0.149*** |
| Speak Russian | -0.018 | -0.221*** | -0.051* | 0.031 | 0.195*** | -0.192*** | 0.029 | -0.035 | 0.081*** | 0.132*** |
| Speak Other Languages | -0.005 | 0.004 | -0.006 | -0.024 | 0.049* | -0.028 | -0.012 | -0.016 | 0.008 | 0.085*** |
| Ethnic Group (Russian) | 0.025 | -0.350*** | 0.054* | -0.045* | 0.085*** | -0.065** | 0.001 | 0.013 | 0.030 | 0.058** |
| Ethnic Group (Ukrainian) | -0.014 | 0.404*** | -0.068** | 0.052* | -0.097*** | 0.050* | -0.007 | 0.022 | -0.104*** | -0.056** |
| Ethnic Group (Other) | -0.017 | -0.189*** | 0.040 | -0.024 | 0.044* | 0.017 | 0.013 | -0.071** | 0.160*** | 0.009 |
| National Pride | 0.076*** | 0.097*** | 0.000 | 0.068** | -0.172*** | 0.081*** | -0.035 | 0.042 | 0.007 | -0.142*** |
| Democracy Evaluation | 0.082*** | 0.029 | -0.038 | 0.168*** | -0.024 | -0.031 | 0.015 | -0.024 | 0.015 | -0.053* |
| Importance of Democracy | 0.061** | 0.072*** | -0.033 | 0.019 | -0.089*** | 0.100*** | -0.047* | 0.001 | -0.036 | -0.076*** |
| Income Inequality | 0.005 | 0.022 | -0.100*** | 0.161*** | 0.044* | -0.058** | -0.043* | -0.059** | 0.078*** | -0.0436* |
| Importance of Competition | -0.063** | -0.007 | 0.054* | 0.029 | 0.003 | -0.044* | 0.065** | 0.031 | 0.028 | -0.0358 |
| Preference for Self-reliance | -0.043* | -0.053* | 0.097*** | -0.198*** | -0.046* | 0.017 | 0.026 | 0.049* | -0.047* | 0.0378 |
| Insecurity Perception | -0.089*** | -0.042 | 0.072*** | -0.110*** | 0.013 | -0.047* | 0.011 | 0.084*** | 0.009 | -0.0434* |
| Worries about War | -0.037 | 0.019 | 0.038 | -0.053* | -0.087*** | 0.00678 | 0.007 | 0.012 | 0.031 | -0.131*** |
| East | 0.032 | -0.095*** | 0.022 | -0.003 | 0.115*** | -0.118*** | 0.012 | 0.043* | 0.001 | 0.0598** |
| West | 0.033 | 0.107*** | 0.023 | -0.039 | -0.363*** | 0.399*** | -0.012 | -0.087*** | -0.083*** | -0.119*** |
| South | -0.060** | -0.063** | -0.035 | -0.033 | 0.103*** | -0.139*** | 0.007 | -0.012 | 0.052* | 0.064** |
| Center | -0.010 | 0.035 | 0.019 | -0.034 | 0.080*** | -0.117*** | -0.018 | 0.071** | -0.014 | 0.003 |
| Kiev | 0.010 | 0.005 | -0.035 | 0.143*** | 0.109*** | -0.0587** | 0.016 | -0.010 | 0.057** | 0.001
|
Source: Author’s calculations using the WVS (2011 and 2020).
*** p<0.01, ** p<0.05, * p<0.1.

Attention
The authors do not work for, consult to, own shares in or receive funding from any company or organization that would benefit from this article, and have no relevant affiliations