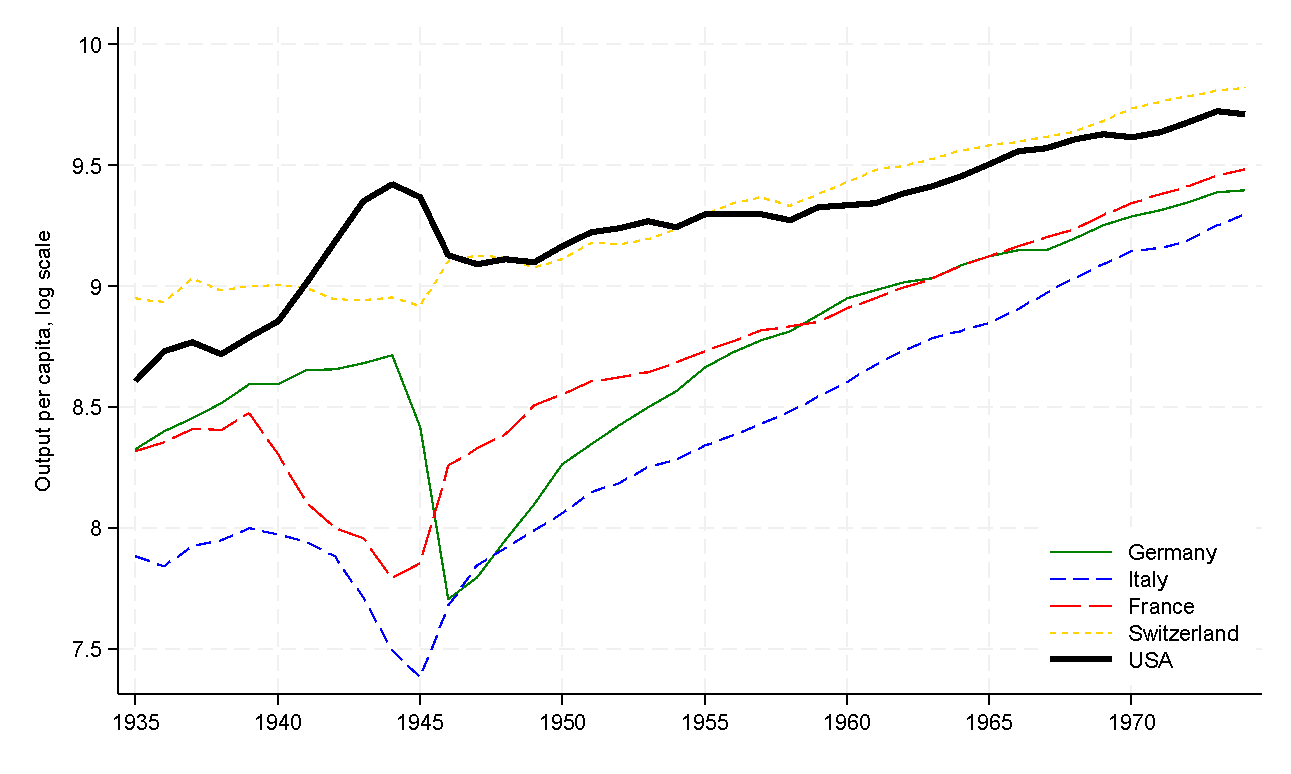
How fast can post-war Ukraine grow? Two key forces will likely shape the economic trajectory. First, fixing the damages inflicted by the Russian invasion will stimulate economic growth. This is similar to the post-1945 acceleration experienced by Germany, France, and Italy – countries with massive destruction of capital during World War II – relative to countries that were not bombed (Figure 1). Second, integration of Ukraine into the European Union (EU) will spur investment and technological transfer. This is similar to the boost in Poland, Czechia, Slovakia and other Eastern European (EE) countries that joined the European Union in the 2000s. We provide a first pass at quantifying these forces.
Figure 1. Economic growth for selected countries
Introduction to growth accounting
Growth accounting offers a simple decomposition of economic growth. Suppose that the production function has constant returns to scale and is given by
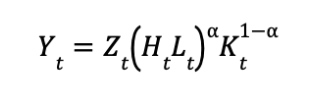
where Yt is output in time t, Zt is total factor productivity, Ht is human capital (this corresponds to the quality of workers), Lt is (employed) population, Kt is physical capital. If we use lower-case letters to denote percent changes (that is, xt≡(Xt–Xt-1)/Xt-1≈log(Xt/Xt-1)), we arrive at
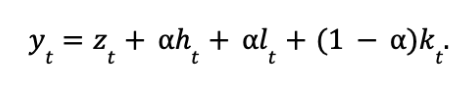
This equation shows that aggregate growth has four components: productivity growth (zt), (working) population growth (lt), accumulation of physical capital (kt), improvements in human capital (ht); α is the labour share of output.
Economic growth with the European Union
We can use this simple framework to get a sense of how much growth Ukraine can expect in “normal” conditions on its EU path. Penn World Tables (PWT), a popular source for economic research on economic growth, report capital stock and other data necessary for this calculation. Figure 2 shows the dynamics for physical capital, human capital, total factor productivity, and employment-to-population ratio (EPOP). Given the large uncertainty about population growth for post-war Ukraine, we do not use this input for now to quantify growth. However, we use EPOP to measure how effectively labor is utilized in the countries. In other words, lt can change because the number of people is changing or because employment rates increase.
According to PWT, the growth rate of TFP in the post-accession years was roughly 0.8% per year in Poland and other EE countries. The growth rate of TFP in the 4 pre-accession years was roughly 2.4% per year. The average TFP growth rate for pre- and post-accession years is approximately 1.5%. Note that some countries have little growth. Specifically, TFP for Romania and Bulgaria is flat. Interestingly, these two countries had problems with corruption and weak institutions and were admitted to the EU later than other Eastern European states.
The quality of human capital was growing at roughly 0.5% per year after accession and 0.7% in the pre-accession period (4 years). EPOP increased by 0.25 percentage points per year in the post-accession period and 0.25 percentage points in the pre-accession period. The growth rate of capital stock was at 2.2% in post-accession and 3.3% in the pre-accession years. This is relatively fast: for comparison, the growth rate of capital stock in Croatia after its Independence War was 2.5%.
Labor share for Ukraine is approximately 0.55, which is close to EE average. With these ingredients, we can compute the growth rate of output if Ukraine behaves like a typical Eastern European country:
1.5%+0.55×0.7%+0.25%+1-0.55×3.3%=3.5%
With this growth rate, output doubles roughly every 16 years. To be clear, this “average” growth rate does not include the contribution of population growth. This exercise also does not take into account that Ukraine may differ from the EE countries in levels of TFP, capital stock, quality, etc. To illustrate these differences, Figure 3 shows time series of percent deviations from Ukraine for key variables (that is, log(Xtcountry/XtUkraine)×100 where X is a variable of interest). Specifically, the level of capital stock per worker in 2019 is 11% higher in Ukraine that in EE countries. This is the legacy of the Soviet economy, and this higher level of capital stock is not adjusted for quality differences (a steel mill built in the USSR is much less efficient than a steel mill built in the EU) or the efficiency of allocation (i.e., some capital may be idle or not used effectively because it is in a “wrong” industry or location). On the other hand, the quality of human capital in 2019 is somewhat (5%) lower in Ukraine. The big difference is in TFP where Ukraine lags by 54% (!) in 2019 relative to the EE countries. The employment-to-population ratio is also considerably lower in Ukraine (approximately 10 percentage points). Some of the difference in the ratio is due to demographic trends but some is due to the large informal sector in Ukraine.
Figure 2. Dynamics of production inputs for select European economies
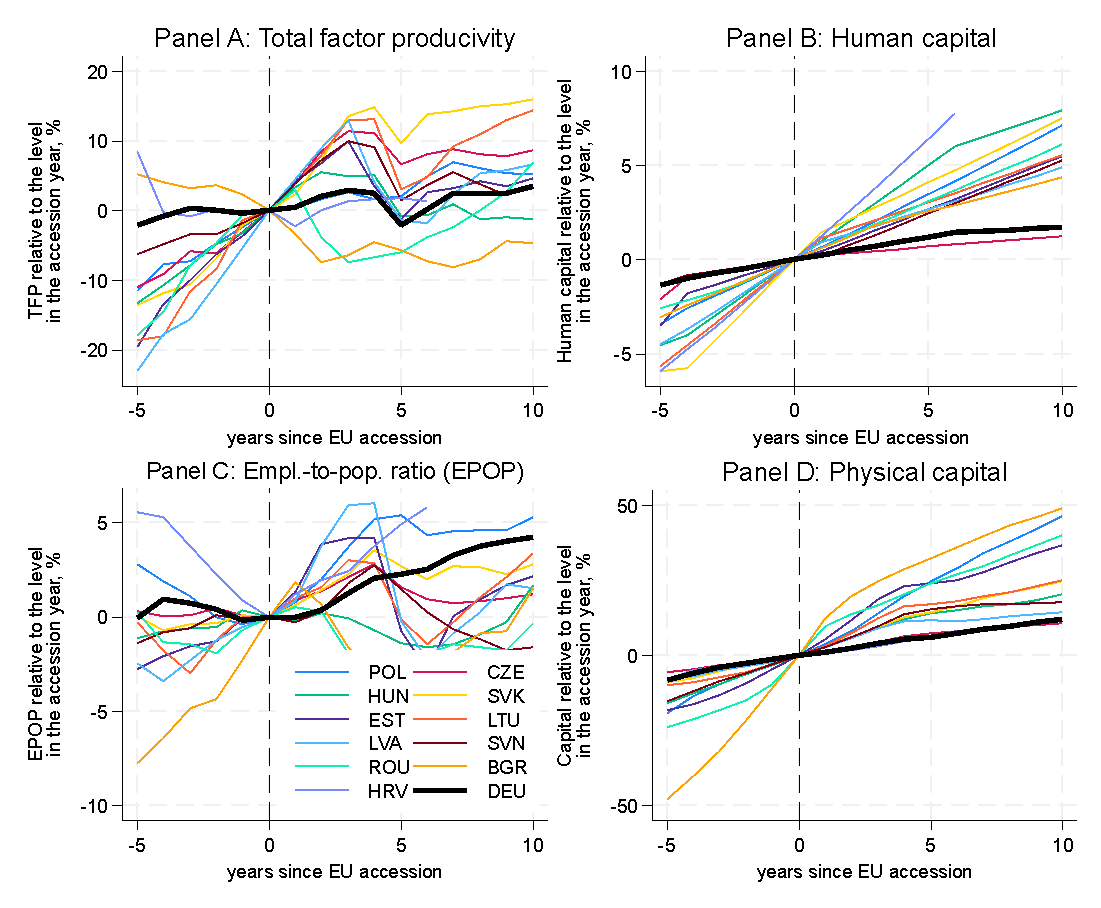
Source: Penn World Tables. The thick, black line shows the results for Germany (DEU) relative to 2004. The dashed, vertical line shows the accession year.
Figure 3. Levels of productivity, employment and capital relative to Ukraine for select Eastern European countries.
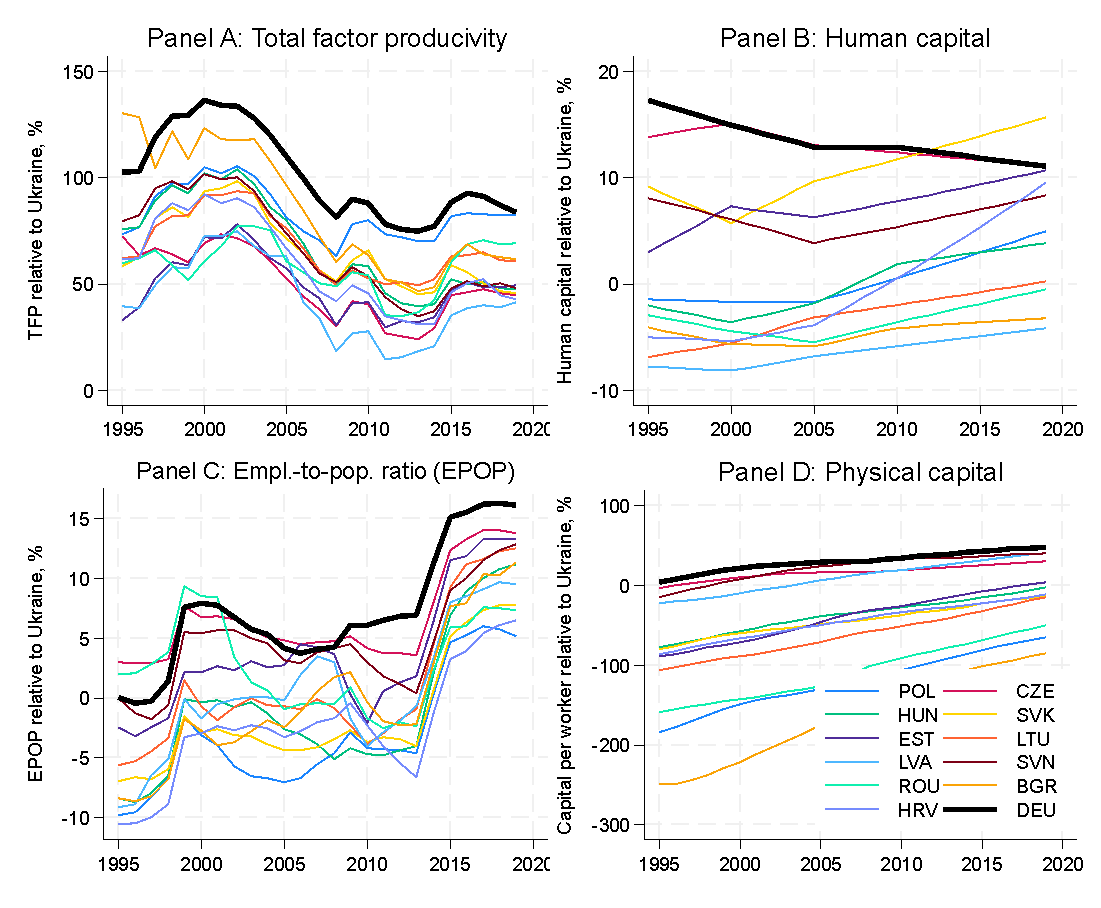
Source: Penn World Tables. The thick, black line shows the results for Germany (DEU) relative to 2004. Panels A, B, and D plot log(Xtcountry/XtUkraine)×100 where X is a variable of interest indicated in the panel title. Panel C plots (Xtcountry–XtUkraine)×100.
Post-war dynamics
To move further, we need to make assumptions about the evolution of the inputs. To keep the analysis simple, we use the Solow model with human capital, the workhorse framework for such analyses. We combine data provided by the State Statistics Service (SSS; this gives more detail) and PWT (this gives consistency). The pre-war initial conditions are based on 2019. We split capital into infrastructure (“engineering structures”/“інженерні споруди” which includes bridges, dams, highways, electrical power lines, etc.) and other physical capital. Hence, the production function is modified to Yt=ZtHtLtBtKt1-α-β where Bt is infrastructure. The rates of depreciation and investment are taken from SSS and PWT. For example, we assume that the depreciation rate for infrastructure and other physical capital is 3% per year, which is the rate used in PWT. Using data from SSS, we assume that the investment rates are 10.9% for physical capital and 3.3% for infrastructure.
The only non-standard element is our setup for the evolution for human capital:
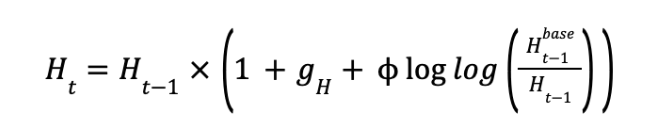
where gH is the baseline growth of quality of human capital and term log Ht-1baseHt-1 captures the catch-up between Ukraine and the base country (in our case, Germany). In PWT, ϕ≈-0.13. This means that if German human capital is 20% better than Ukraine’s in a given year, then the next year the gap will be 1-0.13×20%=17.4%. We model this catch-up process as passive but more investment in education (e.g., exchange programs for Ukrainian students in Germany) can make this catch-up faster (increase in absolute value).
With the fog of war, it is harder to calibrate other ingredients for the calculations. Table 1 presents our assumptions. We assume that approximately 9 million people left the country in 2022 but there will be a gradual reversal in the population size with the largest number of returned refugees in 2024. The Kyiv School of Economics estimates that at least 8% of housing stock has been destroyed since the beginning of the war. This is likely a lower bound because there is no access to the Ukrainian territories currently occupied by the Russians. Hence, we project the destruction rate at 12%. One may expect similar magnitude for other types of capital (including human capital). The rate of destruction appears to have slowed down in 2023 and we use 3% for 2023 (roughly a quarter of the destruction rate in 2022). We assume that productivity will grow at the EU-accession average of 1.5%. The EU pledges €50 billion over 4 years to help Ukraine’s reconstruction. We assume that other allies provide Ukraine with another €50 billion over the same period. We assume that all foreign aid is invested in physical capital and infrastructure (50/50 split). The National Bank of Ukraine estimates a massive increase in unemployment (up to 30%) for 2022 and gradual decline for subsequent years. To capture this dynamic, we assume that employment to population ratio (EPOP) declines by 5 percentage points and then gradually recovers in 2024 and later years. We assume that Ukraine will defeat the Russian aggression in 2024. Obviously, there is large uncertainty around these trajectories and we will explore later how sensitive our results are to alternative assumptions.
Table 1. Assumptions
| Year | Population, million | Rate of destruction of capital, % | Productivity growth, % | Foreign aid,
bn euro |
Employment to population ratio |
| 2021 | 41.00 | 0 | 0 | 0 | 0.375 |
| 2022 | 32.00 | 12 | 0 | 0 | 0.325 |
| 2023 | 33.00 | 3 | 0 | 0 | 0.325 |
| 2024 | 36.00 | 0 | 1.5 | 25 | 0.335 |
| 2025 | 38.00 | 0 | 1.5 | 25 | 0.344 |
| 2026 | 39.00 | 0 | 1.5 | 25 | 0.352 |
| 2027 | 39.50 | 0 | 1.5 | 25 | 0.359 |
| 2028 | 39.90 | 0 | 1.5 | 0 | 0.365 |
| 2029 | 40.20 | 0 | 1.5 | 0 | 0.370 |
| 2030 | 40.40 | 0 | 1.5 | 0 | 0.374 |
| 2031 | 40.50 | 0 | 1.5 | 0 | 0.377 |
| 2032 | 40.55 | 0 | 1.5 | 0 | 0.379 |
| 2033 | 40.55 | 0 | 1.5 | 0 | 0.380 |
Figure 4 shows the path for output in the model calibrated to Ukraine if there is no foreign aid to Ukraine. Consistent with the data, GDP declined by 26% in 2022 and is projected to show modest growth (1.5%) in 2023. Although the economy has rapid growth right after the war, the recovery to the pre-war level takes 3 years. Reaching a US$1 trillion economy (in 2021 prices) takes about 40 years (we assume zero population growth after 2033).
Figure 4. Growth rate of output, no foreign aid
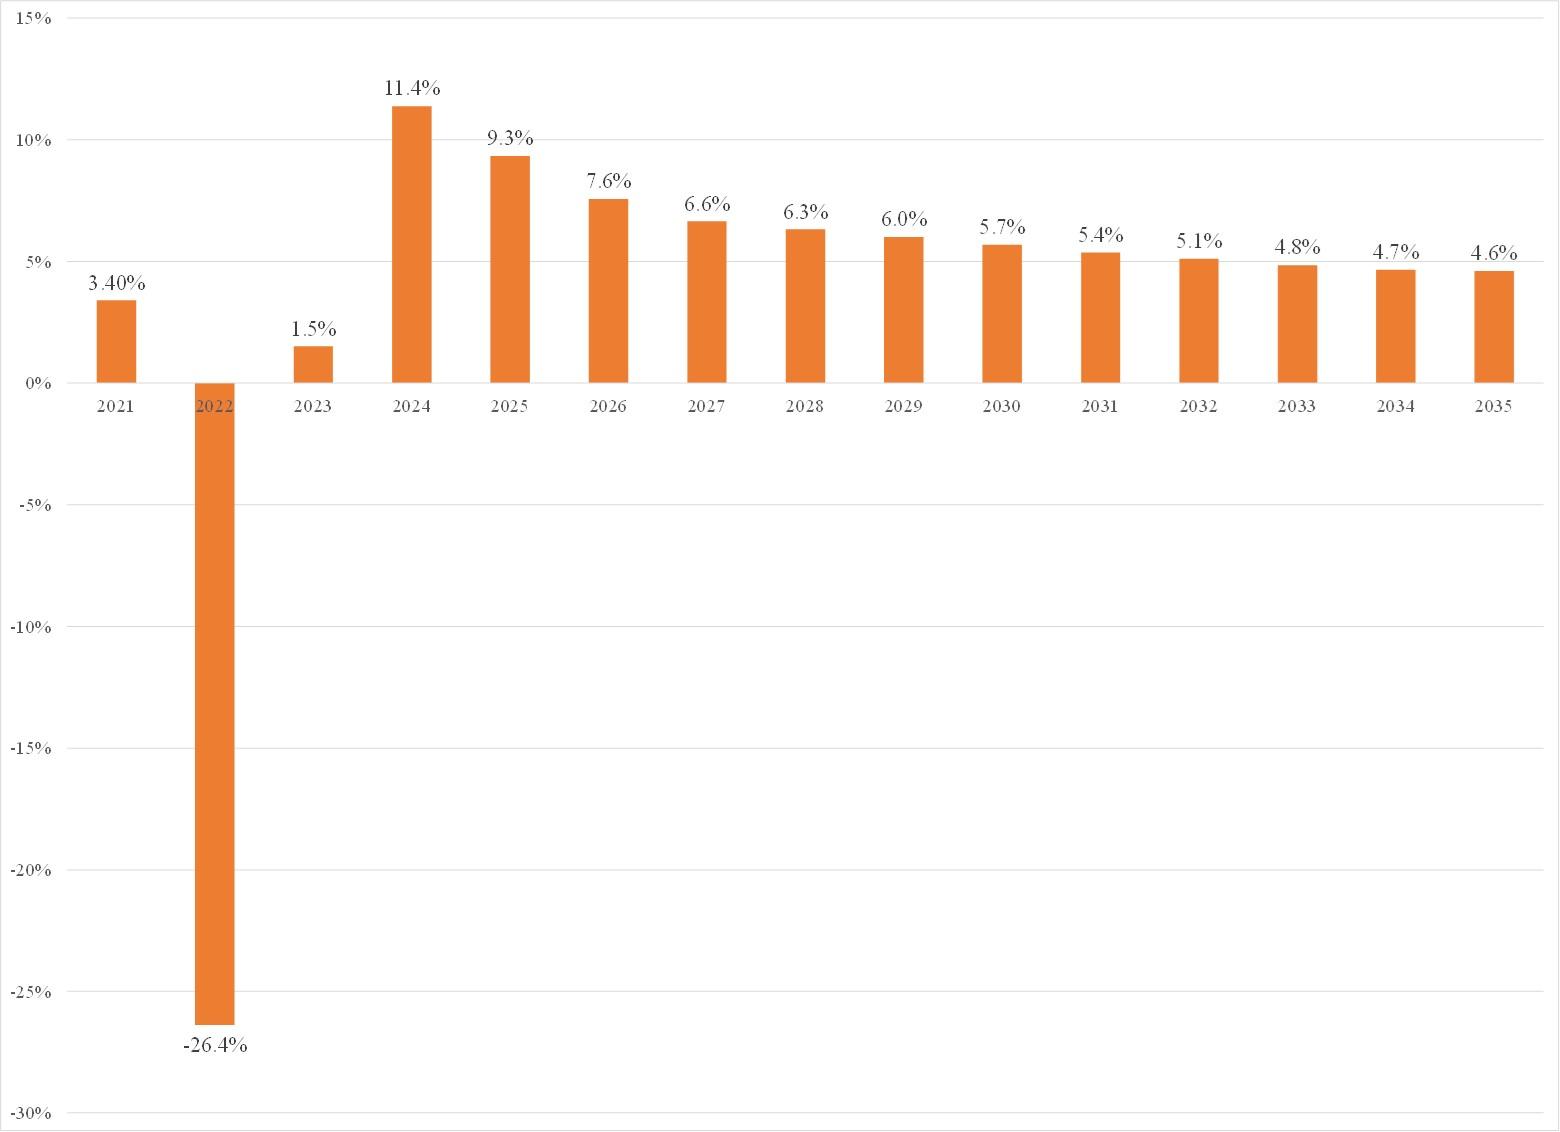
Table 2 presents results for alternative assumptions. Foreign aid (column 2) should boost output growth rate by additional 1.5% per year during the aid period. (This increase may be amplified if the share of investment in infrastructure is more than 50% because Ukraine is relatively poor in terms of infrastructure and investment in this type of capital has high returns.) Now suppose Ukraine improves its institutions and makes investment more attractive. Increasing the investment rate from 14.2% of GDP to 21.2% (column 3) gives another additional 1.4% per year in 2024-2027 (approximately extra 15% over 10 years). Investments in education and science should improve the quality of human capital. Accelerating the convergence in the quality of human capital (ϕ=-0.195) yields another 0.4% in the short run (2024-2027). However, this convergence alone cannot be a large contributor to long-run growth because the frontier level of human capital (proxied with the German level) grows relatively slowly at 0.6% per year. Now suppose that Ukraine’s institutions encourage technological transfer from abroad (e.g., via foreign direct investment) and improve allocation of resources by reducing corruption (recall Romania and Bulgaria). Additional 0.5%/year in TFP growth (that is, 2%/year instead of 1.5%; roughly a high-performance EE country) increases output growth not only directly but also via faster accumulation of capital (column 5).
The growth rate will be much lower (it does not reach double digits) if refugees do not return to Ukraine (population stays at 33 million; column 6). These scenarios suggest that the cost of not reforming Ukraine (and thus not making it an attractive place to live and invest) has a huge cost: the difference between columns (5) and (6) is ≈40% in cumulative growth over the next 10 years.
Table 2. Growth rate of output, alternative assumptions
| Year | Base
(no aid) |
Base
+ Foreign aid |
Base
+ Foreign aid + higher investment rate (post-2024) |
Base
+ Foreign aid + higher investment rate (post-2024) + higher human capital |
Base
+ Foreign aid + higher investment rate (post-2024) + higher human capital + higher TFP |
Base
+ Foreign aid + no return of refugees |
| (1) | (2) | (3) | (4) | (5) | (6) | |
| 2021 | 3.4 | 3.4 | 3.4 | 3.4 | 3.4 | 3.4 |
| 2022 | -26.4 | -26.4 | -26.4 | -26.4 | -26.4 | -26.4 |
| 2023 | 1.5 | 1.5 | 1.5 | 1.5 | 1.5 | 1.5 |
| 2024 | 11.4 | 13.7 | 15.3 | 15.8 | 16.3 | 8.4 |
| 2025 | 9.3 | 11.1 | 12.6 | 13.0 | 13.5 | 7.7 |
| 2026 | 7.6 | 8.7 | 10.1 | 10.4 | 11.0 | 6.9 |
| 2027 | 6.6 | 7.4 | 8.7 | 9.0 | 9.6 | 6.4 |
| 2028 | 6.3 | 6.1 | 7.5 | 7.7 | 8.3 | 5.2 |
| 2029 | 6.0 | 5.8 | 7.1 | 7.3 | 8.0 | 5.0 |
| 2030 | 5.7 | 5.5 | 6.7 | 6.9 | 7.6 | 4.9 |
| 2031 | 5.4 | 5.1 | 6.3 | 6.5 | 7.2 | 4.7 |
| 2032 | 5.1 | 4.9 | 6.0 | 6.2 | 6.9 | 4.5 |
| 2033 | 4.8 | 4.6 | 5.7 | 5.9 | 6.5 | 4.4 |
| 2034 | 4.7 | 4.5 | 5.5 | 5.6 | 6.3 | 4.2 |
| Cumulative | 51.4 | 55.9 | 70.1 | 72.8 | 79.8 | 40.7 |
This analysis suggests that Ukraine will grow fast after the war. However, there is large variation in the potential speed, and it is important to have realistic expectations about economic growth. Clearly, foreign aid to rebuild capital can help Ukraine grow faster but the main engine of growth is elsewhere. Return of refugees, high domestic investment rates, intensive technological transfer, reduced corruption, etc. will determine the long-run growth. Growth miracle can happen in Ukraine, but it is not destiny. It depends on policies chosen by Ukraine and so doing this “homework” must commence immediately.

Attention
The authors do not work for, consult to, own shares in or receive funding from any company or organization that would benefit from this article, and have no relevant affiliations