Every time there is an elections season in Ukraine, the politicians claim that the current elections cycle is the dirtiest in Ukraine’s history. While Ukraine has certainly had a history of fraud in elections–recall the infamous elections in 2004–the scale of fraud in parliamentary and presidential elections in 2014 was much smaller than in previous elections. Do the recent local elections (mayors and city councils) continue the trend of improving standards?
To answer this question, we use three tools often employed to detect fraud. First, we check if voter turnout is correlated with the share of votes received by a given candidate or party. A low correlation is consistent with fair elections. A high correlation does not prove fraud but it raises a red flag. Second, we check the behavior of the cumulative contribution of polling stations as a function of the share of votes cast in favor of a given candidate or party. If the cumulative contribution rises continuously with the share, one should examine the results of elections for potential fraud. On the other hand, if the cumulative distribution quickly flattens, elections are likely to be fair. Third, we use Benford’s law which postulates that the distribution of the first digit of the number of people voting in a polling station is distributed in such a way that the number of “1”s is greater than the number of “2”s which in turn is greater than the number of “3”s and so on. While the typical use of the law involves checking if the distribution of first digits has an L-shape, we also “accept” different shapes as long as the shapes are similar across candidates or parties.
We examine election results for several cities: Kyiv, Dnipropetrovsk, Lviv region and a few cities in Eastern Ukraine (Kramatorsk, Slovyansk and Druzhkivka). We will exclude polling stations with fewer than 300 registered voters and polling stations with fewer than 200 votes because these often behave erratically. To keep our discussed concise, we will focus only on main candidates and parties. Also, one should keep in mind that our analysis is based on election results compiled by volunteer groups or political parties (we hope that the next time Ukraine has local elections, the Central Elections Commission will provide an easy access to the results). We are grateful to these activists for sharing this information with us.
Kyiv
Table 1 shows the results of regressing the share of votes received by a mayoral candidate in a polling station on the voter turnout. The link between voter turnout and the share of votes received is very weak for all main candidates. Even in the case where the correlation is statistically different from zero (Bondarenko), the relationship is quantitative weak: a one percentage point increase in turnout is associated with less than 0.07 percentage point increase in the share of votes (for comparison, the coefficient was close to 0.3 in the infamous elections during the Yanukovich era). This is not enough to change outcomes in any material way.
Table 1. Share of votes and turnout, Mayoral candidates, Kyiv
| VARIABLES | Klichko | Bondarenko | Omelchenko | Bereza |
| (1) | (2) | (3) | (4) | |
| turnout | 0.003 | 0.067*** | 0.030 | -0.015 |
| (0.027) | (0.017) | (0.030) | (0.012) | |
| Constant | 0.404*** | 0.050*** | 0.072*** | 0.094*** |
| (0.011) | (0.007) | (0.012) | (0.005) | |
| Observations | 997 | 997 | 997 | 997 |
| R-squared | 0.000 | 0.033 | 0.002 | 0.001 |
Robust standard errors are in parentheses. ***, **, * denotes statistical significance at 1, 5 and 10 percent level.
Table 2 shows results for elections to the city council. Similar to mayoral elections, there is no strong correlation between voter turnout and the share of received votes. Even in cases of a statistically significant relationship, the link between these is fairly weak. For example, in the most “extreme case”, Batkivschyna got 0.1 percentage point for every percentage point of voter turnout.
Table 2. Share of votes and turnout, city council elections, Kyiv
| VARIABLES | BPP | Ukrop | Batkivschyna | Samopomich | Radikalna | Svoboda |
| (1) | (2) | (3) | (4) | (5) | (6) | |
| turnout | 0.096** | -0.044*** | 0.100*** | -0.042** | -0.021*** | 0.030** |
| (0.046) | (0.011) | (0.028) | (0.019) | (0.006) | (0.015) | |
| Constant | 0.235*** | 0.047*** | 0.047*** | 0.136*** | 0.030*** | 0.064*** |
| (0.019) | (0.004) | (0.011) | (0.008) | (0.002) | (0.006) | |
| Observations | 996 | 995 | 996 | 996 | 990 | 994 |
| R-squared | 0.005 | 0.016 | 0.019 | 0.007 | 0.008 | 0.005 |
Robust standard errors are in parentheses. ***, **, * denotes statistical significance at 1, 5 and 10 percent level.
Figure 1 shows the cumulative contribution of votes as a function of the share of votes cast for a given candidate or party. We observe that the cumulative contributions flatten out quickly and, by 60% share of votes, the contributions barely move. These patterns are consistent with little, if any, fraud.
Figure 1. Cumulative contribution, Kyiv
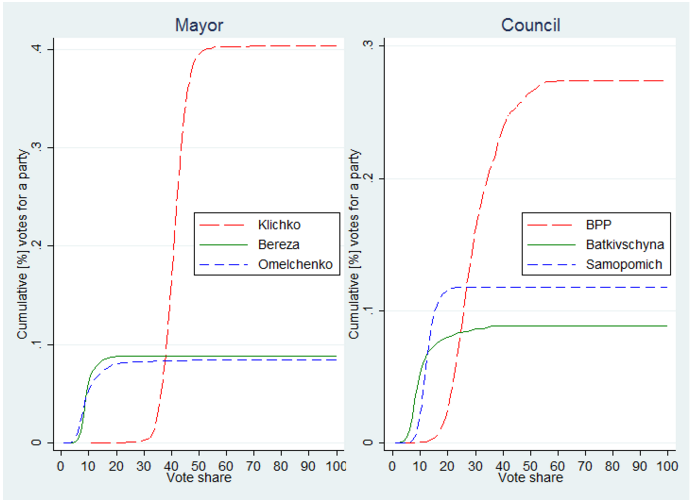
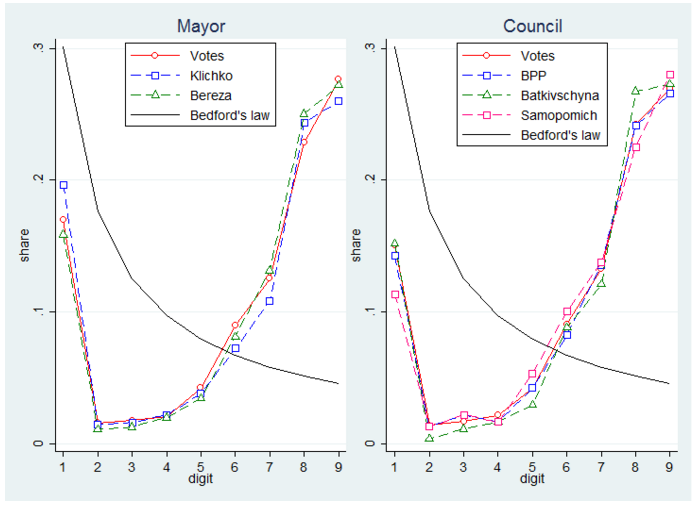
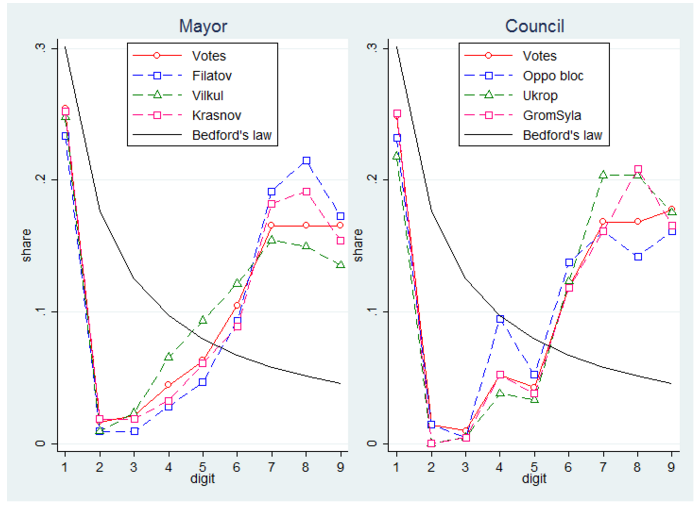
Figure 2 shows the distribution of the first digit for the number of cast votes in districts where a given party or candidate received more votes than the median value. Benford’s law predicts the the distribution of the first digit should be such that the shares for digits are declining in digit. In contrast, we observe that the distribution of the shares is U-shaped. While this pattern is suspicious, we find the the shape is similar across candidates and parties. This similarity suggests that the distribution of the first digit is confounded by a force not captured by Bedford’s law (e.g., the size of polling stations) but the strength of the force is approximately uniform across candidates and parties and, hence, one has little reason to suspect fraud.
Figure 2. Benford’s law for Kyiv
Dnipropetrovsk
Tables 3 and 4 show the correlation between the share of votes received and turnout. Similar to Kyiv, there is only a weak relationship between these two. Even if the relationship is statistically significantly different from zero, the quantitative significance is small: a one percentage point increase in turnout is associated with at most 0.11 percentage point increase (or decrease) in the share.
Table 3. Share of votes and turnout, Mayoral candidates, Dnipropetrovsk
| VARIABLES | Filatov | Vilkul | Krasnov |
| (1) | (2) | (3) | |
| turnout | 0.044 | -0.118*** | 0.105** |
| (0.046) | (0.030) | (0.044) | |
| Constant | 0.334*** | 0.426*** | 0.077*** |
| (0.019) | (0.014) | (0.019) | |
| Observations | 399 | 399 | 399 |
| R-squared | 0.005 | 0.041 | 0.025 |
Robust standard errors are in parentheses. ***, **, * denotes statistical significance at 1, 5 and 10 percent level.
Table 4. Share of votes and turnout, city council elections, Dnipropetrovsk
| VARIABLES | GromSyla | BPP | Opposition Bloc | Samopomich | Ukrop |
| (1) | (2) | (3) | (4) | (5) | |
| turnout | 0.063 | 0.047** | -0.047 | 0.057*** | 0.109** |
| (0.048) | (0.023) | (0.050) | (0.017) | (0.046) | |
| Constant | 0.060*** | 0.052*** | 0.323*** | 0.034*** | 0.201*** |
| (0.020) | (0.010) | (0.022) | (0.007) | (0.020) | |
| Observations | 393 | 393 | 393 | 393 | 393 |
| R-squared | 0.008 | 0.006 | 0.005 | 0.034 | 0.024 |
Robust standard errors are in parentheses. ***, **, * denotes statistical significance at 1, 5 and 10 percent level.
Also similar to elections in Kyiv, elections in Dnipropetrovsk show that the cumulative contribution flattens out quickly (Figure 3) and the distribution of the first digit is similar across candidates or the total number of votes (Figure 4). Thus these simple tests fail to detect clear signs of quantitatively important fraud in Dnipropetrovsk either.
Figure 3. Cumulative contribution, Dnipropetrovsk
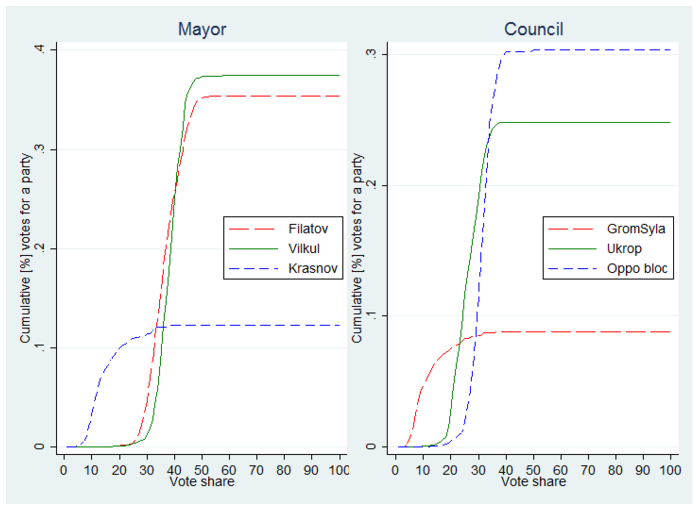
Figure 4. Benford’s law for Dnipropetrovsk
Lvivska oblast
Table 5 shows the estimated relationship between the share of votes received by a party in city council elections and voter turnout for Lvivska oblast. In contrast to Kyiv and Dnipropetrovsk, the relationship is somewhat stronger. Specifically, a one percentage increase in turnout is associated with 0.3 percentage point increase in the share received by BPP and 0.3 percentage point decrease in the share received by Samopomich. As we discussed above, this correlation does not mean that there is fraud. Voters could have been more motivated to vote in areas with stronger support for BPP and less motivated to vote in areas with stronger support for Samopomich. However, these results call for more scrutiny of the voting process in Lvivska oblast.
Table 5. Share of votes and turnout, city council elections, Lvivska oblast
| VARIABLES | Svoboda | BPP | Samopomich | Grom Position | Batkivschyna |
| (1) | (2) | (3) | (4) | (5) | |
| turnout | -0.090*** | 0.344*** | -0.300*** | -0.019 | 0.078*** |
| (0.015) | (0.032) | (0.018) | (0.017) | (0.013) | |
| Constant | 0.174*** | 0.013 | 0.308*** | 0.087*** | 0.043*** |
| (0.009) | (0.018) | (0.011) | (0.009) | (0.008) | |
| Observations | 1,556 | 1,556 | 1,556 | 1,556 | 1,556 |
| R-squared | 0.022 | 0.073 | 0.161 | 0.001 | 0.017 |
Robust standard errors are in parentheses. ***, **, * denotes statistical significance at 1, 5 and 10 percent level.
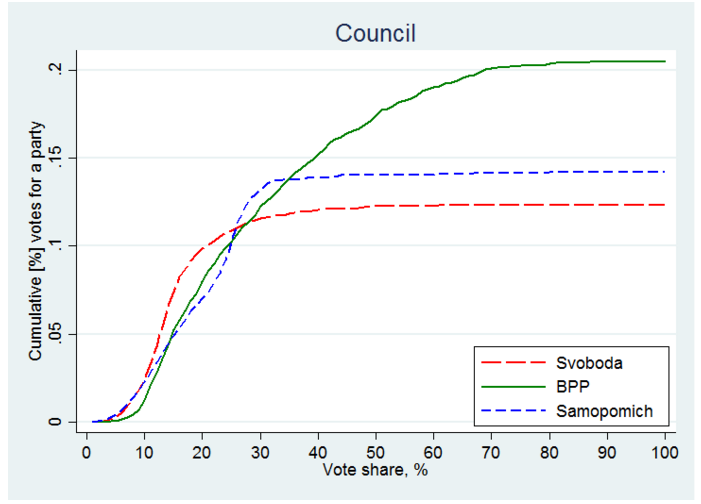
In contrast to Figures 1 and 3 for Kyiv and Dnipropetrovsk, Figure 5 shows that the cumulative share is increasing in the vote share for BPP even for relatively high shares of votes casts for BPP. And we do not observe a similar pattern for other parties. Again, this does not prove fraud but it does raise concerns.
Figure 5. Cumulative contribution, Lviv region
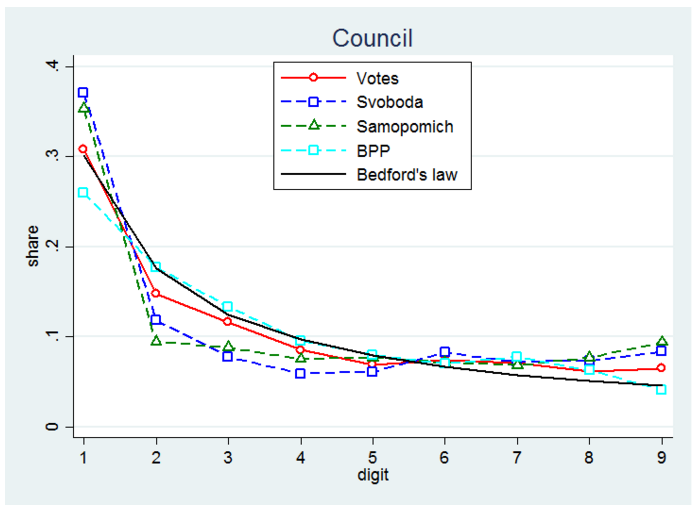
Again in contrast to Kyiv and Dnipropetrovsk, Lvivska oblast has the distribution of the first digits close to Benford’s law: instead of having a U-shape, now the distribution is a nice decreasing function. Similar to the previous cases, the difference in the shape of the distribution is small across parties. Thus, this test finds no clear sign of fraud although some results raise doubts.
Figure 6. Benford’s law, Lvivska oblast
Eastern Ukraine
We further investigate the possible fraud in the local election by taking a look on the results from three cities in Eastern Ukraine, namely Druzhkivka, Slovyansk and Kramatorsk. Because all of them contain a small number of constituencies, we combine the data across cities to improve statistical power. Table 6 reports results for the link between the share of votes and the turnout rate. The results are quite similar to the previous findings: there is no clear fraud. However, there are a few minor differences. For instance, a one percentage point increase in turnout is associated with almost 0.5 percentage point increase in the share received by the Opposition Bloc and 0.6 percentage point decrease in the share received by Nash Kraj. Such high correlation is suspicious.
Table 6. Share of votes and turnout, city council elections, Druzhkivka, Slovyansk and Kramatorsk
| VARIABLES | BPP | Nash Kraj | Opposition | Samopomich |
| turnout | 0.043 | -0.648*** | 0.491*** | -0.027 |
| (0.058) | (0.114) | (0.122) | (0.074) | |
| Constant | 0.071*** | 0.414*** | 0.375*** | 0.112*** |
| (0.016) | (0.044) | (0.052) | (0.022) | |
| Observations | 133 | 133 | 133 | 51 |
| R-squared | 0.118 | 0.562 | 0.149 | 0.625 |
Robust standard errors are in parentheses. ***, **, * denotes statistical significance at 1, 5 and 10 percent level. City dummy variables are included, but not reported.
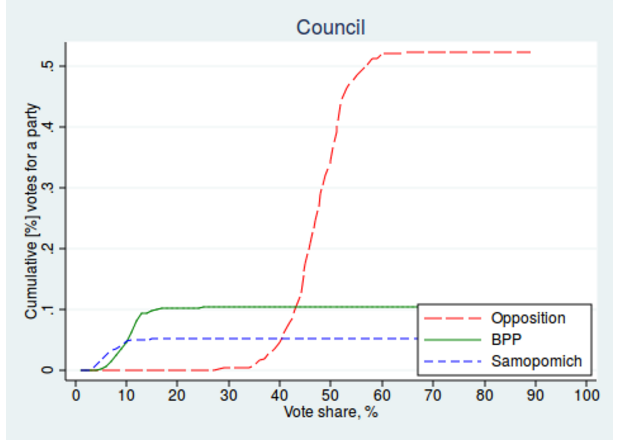
Figure 7 shows cumulative distribution for vote shares of the Opposition Block, BPP and Samopomich. Similar to Figure 1 (Kyiv) we observe that cumulative distributions flatten very quickly by about 60%. Thus, we do not see any evidence of fraud in this case either.
Figure 7. Cumulative contribution, Druzhkivka, Slovyansk and Kramatorsk
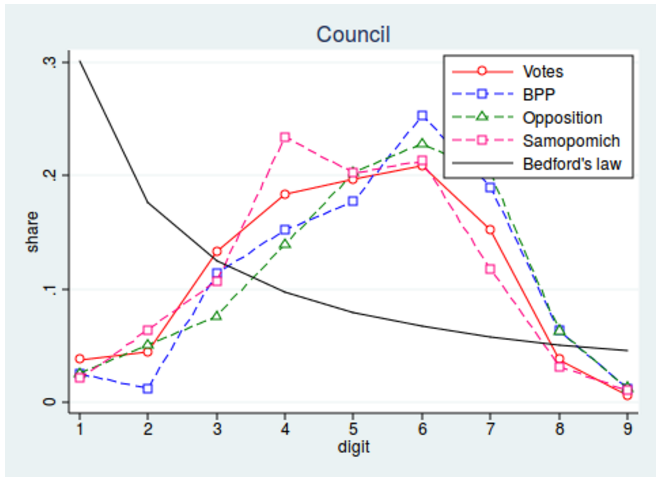
Finally, Figure 8 presents a check of whether Benford’s law holds for these cities. Again, the shape of the distributions is different from the law’s predictions: we observe an inverted U-shape curve. However, the distributions are similar for all three parties, which is consistent with little if any fraud.
Figure 8. Benford’s law, Druzhkivka, Slovyansk and Kramatorsk
Concluding remarks
Elections are never easy in countries undergoing major transformations of the political landscape. New faces are replacing old faces in politics and the incumbents fight fiercely to stay in power. In this environment, having legitimate and fair elections is the key to make the transition smooth and peaceful. Ukraine is certainly making important steps to ensure the high quality of the election process. Similar to recent rounds of plebiscite in Ukraine, the current elections are not perfect but there is also no clear sign of fraud. Indeed, popular statistical tests fail to find indications of consistently rigged voting. Even in highly competitive elections (e.g. Dnipropetrovsk) or in difficult security conditions (e.g. Eastern Ukraine). Obviously, some outrageous excesses can happen, but these used to be a norm and now they are exceptions. Even if results of local elections are not pleasant for the current coalition and the government, they should accept it and move on. Gradually, Ukraine is making progress in establishing a genuine democracy. It may take many rounds of elections but we have to start somewhere.


Attention
The authors do not work for, consult to, own shares in or receive funding from any company or organization that would benefit from this article, and have no relevant affiliations