Significant spikes in violence and social crises, such as war, change people’s behavior and beliefs, including in the religious sphere. Some people turn to “higher powers” for protection, pray for preserving life and health, and for victory in war. Others turn to religion to find meaning in the avalanche of violence, suffering, and loss that has descended upon their lives like the February snow. On the other hand, traumatic events can have a negative impact on a person’s religious beliefs and spirituality. Traumatic events can lead to a crisis of faith, causing believers to question the natural or divine order (Wilson & Moran, 1998). When traumatic stress takes hold, people may ask questions like: Why did God allow this to happen to me? Does God really exist? “My God, my God, why have you forsaken me?” (Psalm 22:2). In this article, we explore how religiosity among Ukrainians has changed over the course of 6 months of full-scale war through the lens of existing research and two prominent social theories.
Review of research and key theories
The key factor driving changes in religiosity is the threat to life.
Most often, to explain the relationship between religiosity and war, (1) Terror Management Theory and (2) Ronald Inglehart’s Existential Insecurity Theory are used. According to the first theory, belief in eternal life serves as a protective mechanism that helps manage thoughts of death, which become salient during times of war. Symbolic immortality, or at least longevity, can be achieved through participation in culturally meaningful communities and organizations that continue to exist after an individual’s death, in the memory of human achievements and heroic acts, in the family, and so on. The second theory explains the increase in religiosity as a response not only to immediate threats to an individual but also to the overall atmosphere of (in)security and (un)certainty in society. The values of a society facing dangers become more closely associated with tradition and religion compared to communities living in abundance and security.
Research on the impact of war on people’s religiosity is inconsistent, and the influence can be either positive, negative, or neutral. Moreover, it appears that the impact of war varies across different age groups. The effect can also change depending on the time elapsed since the war experience.
Among those experiencing an increase in religiosity are individuals who have experienced violence and service members in combat zones. The former tend to pray more often (e.g., Sosis and Handwerker (2011) mention Hezbollah rocket attacks on northern Israel using familiar to Ukrainians MLRS systems like the “Grad”), attend religious services more frequently (Henrich et al., 2019; Ruiter & Tubergen, 2009; Du & Chi, 2016; Immerzel & van Tubergen, 2013), are more likely to identify as religious (Zussman, 2013; Du & Chi, 2016; Immerzel & van Tubergen, 2013), believe in God (Du & Chi, 2016), and rate the importance of God in their lives higher (Tuki, 2023). Members of the military who have had encounters with the enemy also tend to attend religious services, pray more, and consider religion important to them (Cesur et al., 2018). Moreover, those suffering more from the war are more likely to join religious groups than other social groups after the war (Zussman, 2013). Longitudinal comparative studies show that nations with more acute and destructive conflicts generally have a higher level of religious practice (Echeverría Vicente et al., 2022).
A negative impact on religiosity is observed among individuals with strong religious beliefs before the traumatic experience (ter Kuile & Ehring, 2014; Janoff-Bulman, 1989). Military personnel who have experienced killing or were unable to prevent another person’s death become less religious (Fontana & Rosenheck, 2004).
However, a recent systematic review of studies on the impact of trauma on religiosity suggests that most people do not change their religious beliefs after trauma (Leo et al., 2021). Norris and Inglehart’s (Norris & Inglehart, 2004: p. 17) original hypothesis suggests that a person’s religiosity is primarily formed in childhood and tends to remain stable throughout life. This means that the impact of war on the religiosity of adults may be relatively muted or not immediately noticeable.
Methodology
The study is part of an ongoing project aimed at identifying and explaining changes in the religious, political, and value orientations of Ukrainians after the start of the full-scale war based on panel data. The data includes two waves of surveys: the first was conducted from January 18 to February 8, 2022, using face-to-face interviews (F2F), and the second wave was conducted from August 24 to October 6, 2022, using computer-assisted telephone interviews (CATI). In the first wave of the study, 1531 respondents participated [1]. In total, 595 respondents participated in both waves of the survey, corresponding to a response rate of 39% (more details on the data are provided in the appendix). When we refer to the data as panel data, we mean that the same questions were asked to the same individuals, allowing us to track not only general trends but also individual changes in respondents’ religiosity.
Indicators of religiosity
To measure religiosity, we used three indicators:
- Self-assessment of religiosity (rated on a scale from 0 to 10);
- frequency of church attendance (every day, more than once a week, once a week, at least once a month, only on religious holidays, less often, never);
- frequency of prayer (every day, more than once a week, once a week, at least once a month, only on religious holidays, less often, never).
Additionally, based on these indicators, we created a Religious Involvement Index (alpha = 0.83, CFI = 1.00; TLI = 1.00; RMSEA = 0.00) [2]. The procedure for calculating the Religious Involvement Index involved averaging the standardized values of the three religiosity indicators (Koscielniak et al., 2022).
The standardization of variables was performed on a combined dataset of two survey waves. Our study used a composite index designed to measure overall religiosity and individual variables as religiosity indicators. To facilitate the interpretation of the index values, it was linearly transformed to a scale of 0-1, where 0 represents the least religiously involved respondents, and 1 illustrates the most religiously involved.
How has the religiosity of Ukrainians changed during the war’s first six months?
The results depict a nuanced picture characterized by different dynamics across various religiosity indicators. For instance, although nearly half of the respondents increased their self-assessment of religiosity, the frequency of religious practices such as prayer and church attendance generally remained stable (see Table 1) [3].
Notably, during the first six months of the war, 32% of panel participants started attending church more frequently, while 26% reduced the frequency of their church visits. On the other hand, 38% of respondents began to pray more often, with only 18% praying less frequently. Therefore, the percentage of those who started attending church less regularly is higher than those who prayed less often. These data may indicate a tendency toward individualization in religious life, where people choose a personal spiritual path amid broader social and political instability. However, when interpreting the results, it is essential to remember that external factors, such as the destruction of churches by Russian missile attacks, forced displacement, or fear of mass gatherings, may limit access to religious institutions, which could explain the differing dynamics in individual and collective religious practices.
Table 1. Distribution of respondents by changes in religiosity indicators (% of respondents)
| Self-assessment of religiosity [4] | Frequency of individual religious practice (prayer) | Frequency of public religious practice (church attendance) | Religious Involvement Index | |
| The indicator increased | 48.5 | 38.2 | 32.2 | 54.1 |
| The indicator remained unchanged | 25.7 | 43.8 | 41.9 | 14.7 [5] |
| The indicator decreased | 25.7 | 18.0 | 25.9 | 31.2 |
The sum of the columns is 100%. The largest group of respondents in each column is highlighted in bold.
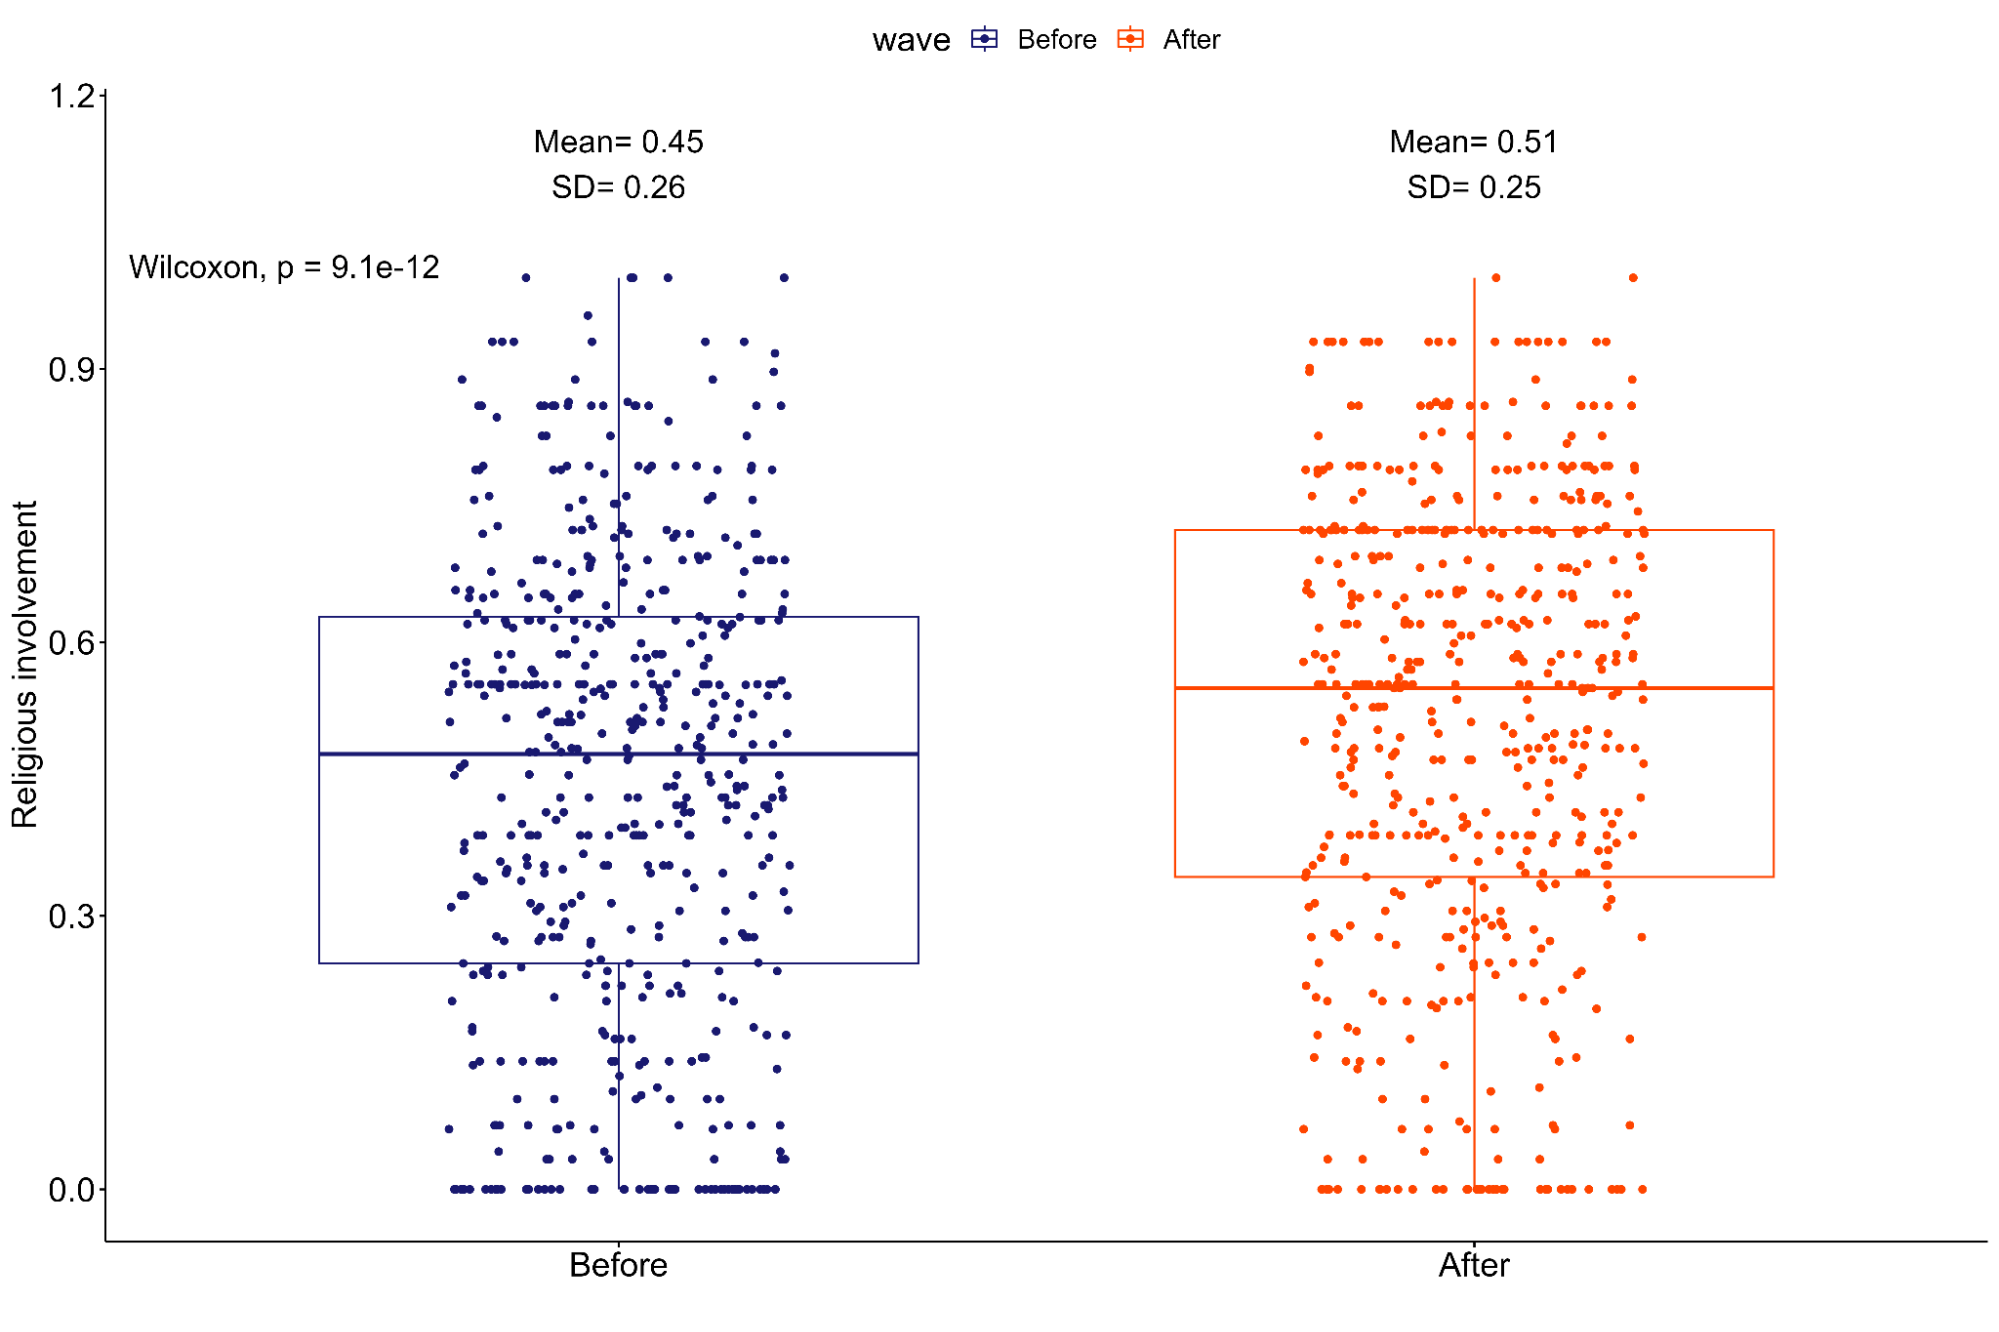
Let us move on to the aggregated indicators. According to our index, the data show a significant increase in overall religiosity after the invasion (Graph 1). Specifically, the average religiosity score increased from 0.45 (SD = 0.26) to 0.51 (SD = 0.25) in standardized values (p < 0.01).
Graph 1. Dynamics of Religious Involvement [6]
When examining the average values of the index components (Table 2), one can observe a significant increase in both religious self-identification and prayer frequency. However, when comparing the mean values, no statistically significant changes were found in the frequency of attending religious services.
Table 2. Comparison of mean values of religiosity indicators between the waves (2022). Standard deviations are indicated in parentheses.
| January 18 –
February 8 |
August 24 –
October 6 |
|
| Self-assessment of religiosity (0-10) | 5.08 (3.05) | 5.77*** (2.95) |
| Frequency of prayer (1-7) | 4.25 (2.41) | 4.95*** (2.36) |
| Frequency of Church Attendance (1-7) | 3.03 (1.38) | 3.12 (1.46) |
The significance of the t-test for paired samples: * p < 0.05, ** p < 0.01, *** p < 0.001.
When examining our indicators in detail, it can be noticed that the increase in prayer frequency is associated with a significant increase in the number of individuals practicing daily prayer while simultaneously reducing the proportion of those who never pray (see Figure 2.1; individual changes can be viewed on the interactive graph).
Chart 2.1: Dynamics of Individual Religious Practice (Prayer)
“Besides when you visit a church (chapel, mosque, synagogue, etc.), how often do you pray?”
The yellow dots represent the proportion of responses in the second wave. The opposite end of the line represents the proportion of responses in the first wave.
Graph 2.2. The dynamics of individual religious practice (prayer)
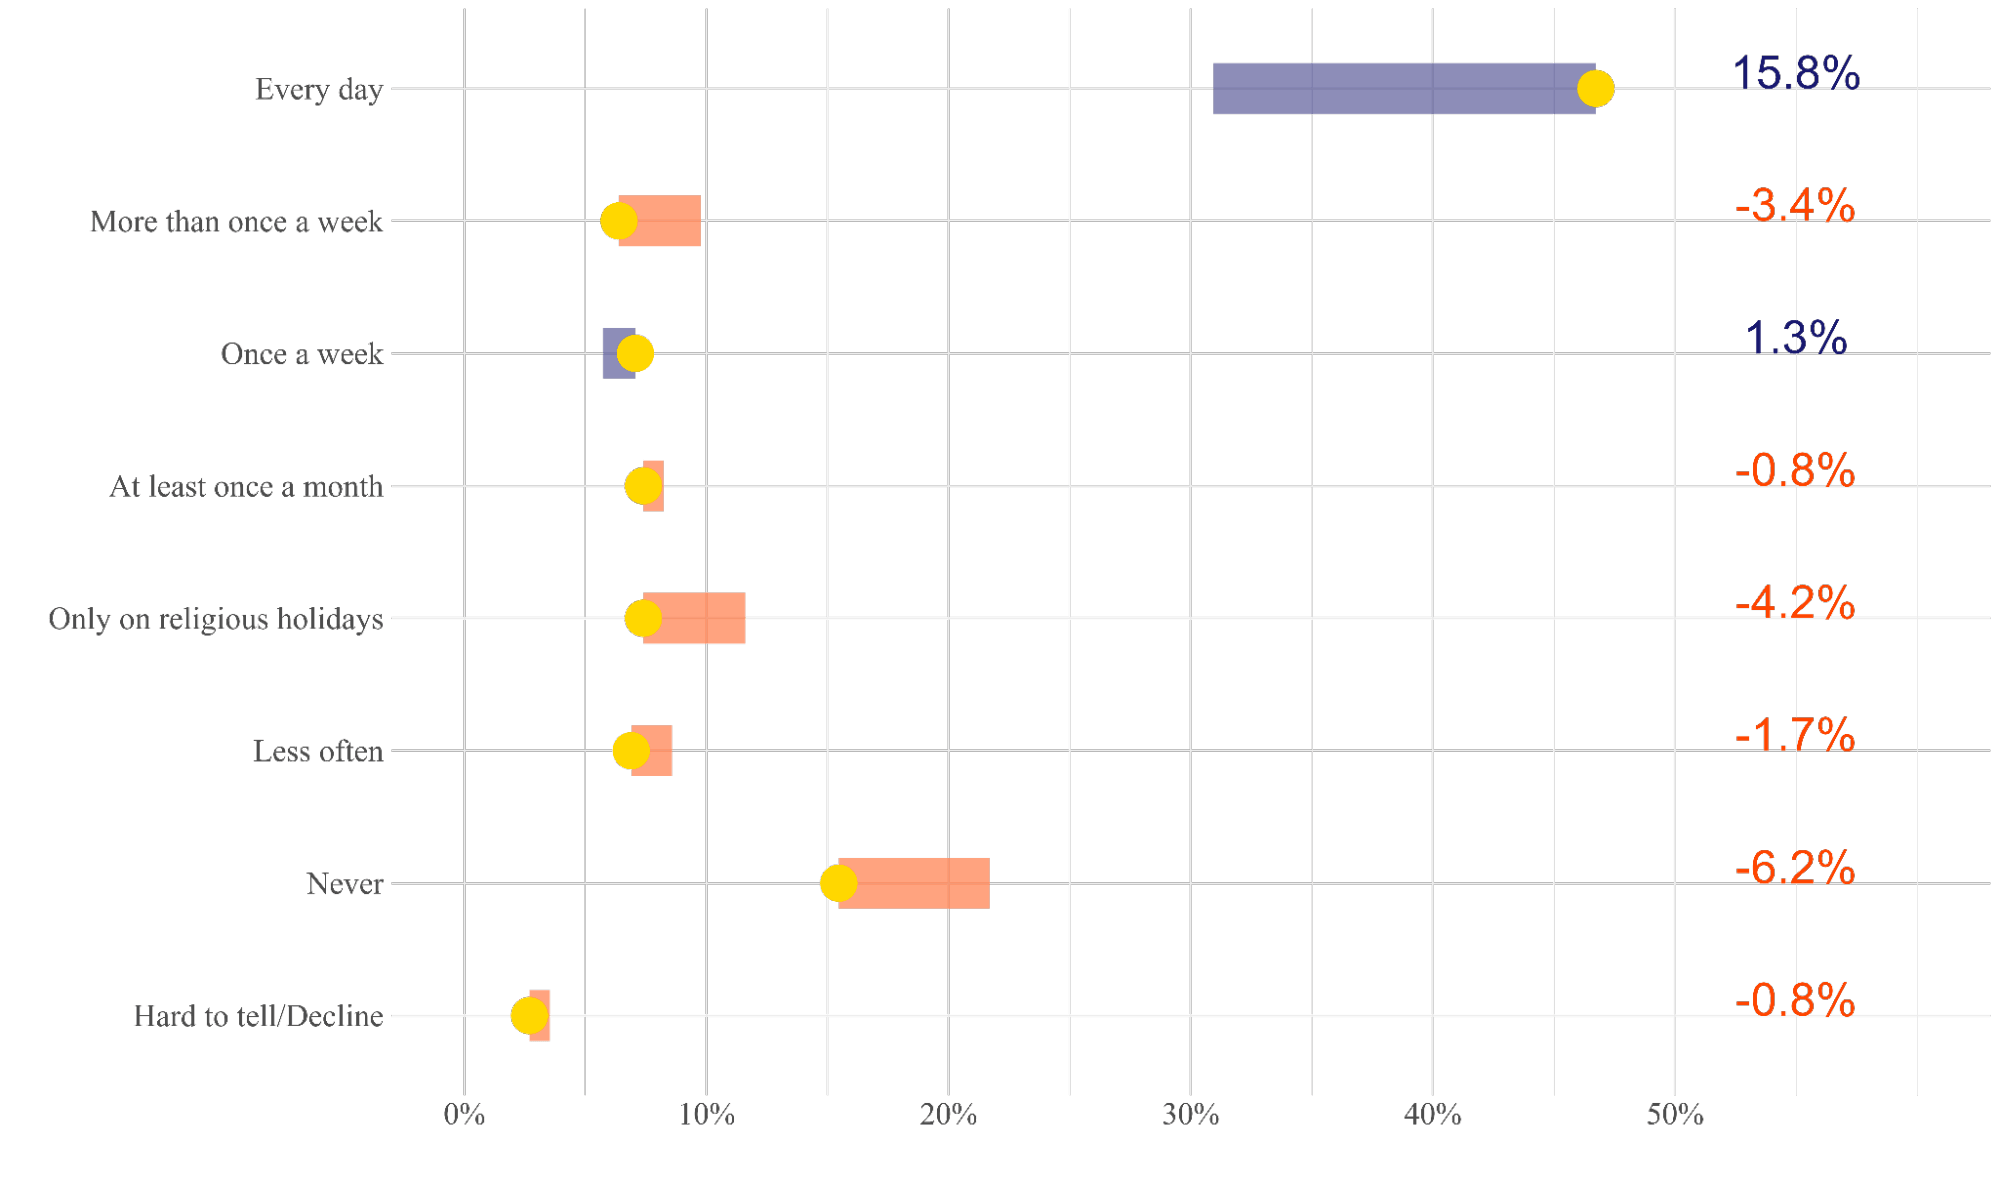
While the average values for religious attendance did not undergo significant changes, a more detailed analysis of individual categories of attendance reveals a statistically significant decrease in the number of individuals who attend church exclusively on religious holidays (see Figure 3.1; individual changes can be viewed on the interactive graph 3.2).
Graph 3.1. The dynamics of public religious practice (church attendance).
“Excluding events like weddings or funerals, how often do you currently attend a church (temple, mosque, synagogue, etc.)?”
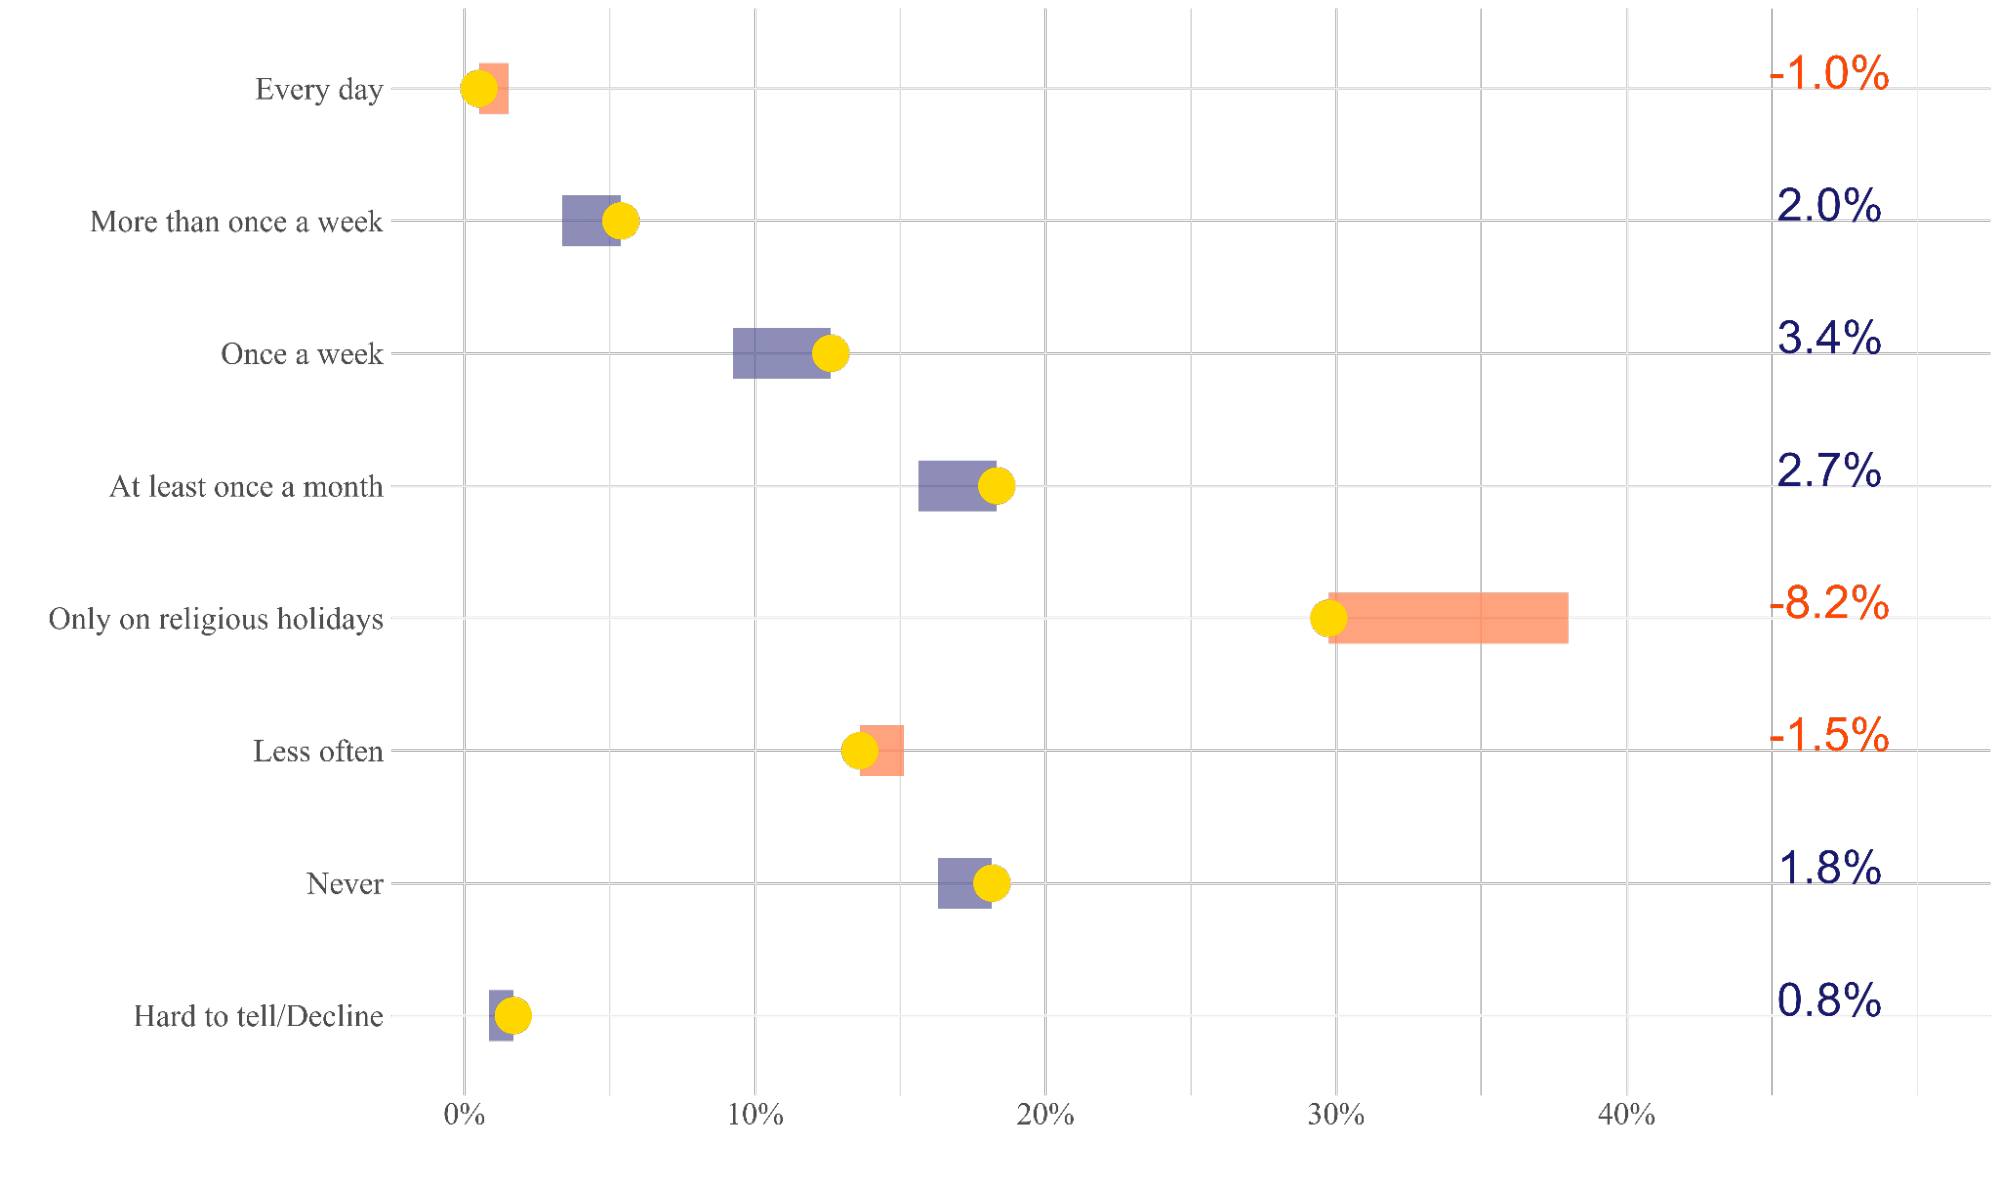
The yellow dots represent the percentage of responses to the question in the second wave. The opposite end of the line represents the percentage of responses in the first wave.
Graph 3.2. The dynamics of public religious practice (church attendance).
Conclusions
War is not only a political and social catastrophe but also a profound test for the spiritual dimension of humanity. So, are there atheists in wartime? We can conclude that in the first few months of the war, there were indeed fewer atheists, although new ones also emerged.
The data indicate an increase in the level of subjective religiosity, accompanied by less intense changes in religious practices. This may suggest that personal beliefs can adapt more quickly to extreme circumstances than social religious practices.
At the same time, the consequences of the conflict may become more pronounced in the following generations, especially among children who have grown up in an environment marked by war, as they develop their religious beliefs and practices as they mature. It is important to remember that our data capture only a “snapshot” of the situation, i.e., information from the first six months of the war. What will happen in twenty years is an open question.
Limitations of the study
Threats to its external validity, namely the ability to generalize the results to the entire population of Ukraine, unquestionably represent a limitation of the study. Calculating the sampling error is challenging and accurate only when complete information about the general population is available, which is not the case during a war. The theoretical sampling error only informs the reader about the sample size of the study and the ability of the researchers from the polling companies to calculate the square root of the number. However, it should be noted that compared to the first wave of the survey, the panel sample is biased toward residents in the Western region, larger urban areas, and respondents with higher education. (More details in Appendix 1).
References
Appendices
Appendix 1. Socio-demographic characteristics of the sample. Comparison of sample characteristics between the panel study and the initial study from which respondents were recruited into the panel.
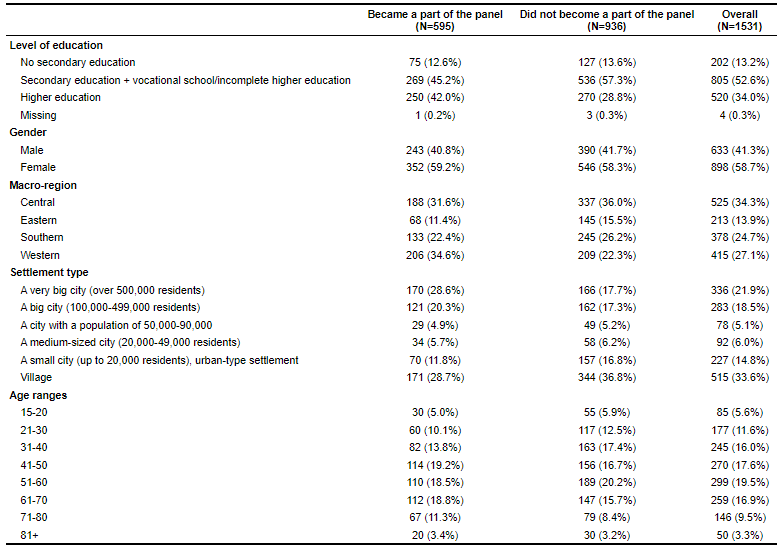
*The composition of the macro-regions is as follows: the Western macro-region (the Volyn, Rivne, Lviv, Ivano-Frankivsk, Ternopil, Zakarpattia, Khmelnytskyi, and Chernivtsi regions), the Central macro-region (the Vinnytsia, Zhytomyr, Sumy, Chernihiv, Poltava, Kirovohrad, Cherkasy, Kyiv regions, and the city of Kyiv), the Southern macro-region (the Dnipropetrovsk, Zaporizhzhia, Mykolaiv, Kherson, and Odesa regions), and the Eastern macro-region (the Donetsk, Luhansk, and Kharkiv regions).
[1] The first wave of the study, which served as the basis for the panel data set, was conducted with the financial support of the International Renaissance Foundation and the Embassy of Sweden in Ukraine.
[2] A high value of the Cronbach’s alpha coefficient (alpha = 0.83) indicates that the measurement tool (index) is internally consistent. This means that the responses to the questions used to measure religiosity systematically correlate with each other. On the other hand, high values of CFI and TLI, along with a low value of RMSEA (indices of model fit), obtained from the confirmatory factor analysis for the one-factor model, also confirm that the correlation between these variables can be well explained by a single latent concept.
[3] Colleagues from the Razumkov Centre obtained somewhat different results in their research, which can be reviewed through the provided link. Variations in the research methodology can explain the difference in results. In our study, we compared responses given by the same individuals at different times, while in the Razumkov Centre’s research, respondents retrospectively assessed changes in their own religiosity.
[4] “Regardless of whether you identify with a specific faith, please tell us how religious you consider yourself to be on a scale from 0 (‘Not religious at all’) to 10 (‘Very religious’).”
[5] We considered that religiosity had not changed if the change in the index value was less than 0.1.
[6] The graph depicts two box-and-whisker plots. The upper and lower lines of the “box” indicate the boundary where 25% of the least and most religious respondents are, respectively. The line inside the “box” represents the median of the distribution. The “whiskers” extending from the “box” show the minimum and maximum values in the data that are not outliers (in our case, 0 and 1).


Attention
The authors do not work for, consult to, own shares in or receive funding from any company or organization that would benefit from this article, and have no relevant affiliations