War touches every aspect of life—both for individuals and for society as a whole—making it of particular interest to the social sciences. According to the theory of evolutionary modernization (Inglehart, 2018), a heightened sense of insecurity affects many areas of our lives: it changes our views, behaviors, and beliefs as people begin to prioritize whatever helps them survive.
Many sociological agencies and research centers have compared Ukrainians’ opinions before and during the war. However, pre-war and wartime surveys typically involve different samples of respondents. This makes it difficult to determine whether shifts in attitudes are due to the war itself or to other factors—like demographic changes caused by displacement or occupation, which can make some people unreachable for surveys.
The Kyiv School of Economics managed to address this limitation through the panel study Life in War Survey (LIWS). We surveyed the same individuals twice: just weeks before the invasion (in January–February 2022) and again half a year later, in August–October 2022. This means we can (cautiously) attribute changes in responses to the outbreak of full-scale war rather than to unrelated factors. The study captured the initial “shock” reaction—before people had time to adapt. Over time, their views will inevitably be shaped not only by the invasion itself but also by everything that unfolds throughout the war. Importantly, we spoke to the same individuals in both waves. This allows us to observe not only how society as a whole changed “on average” but also how each person changed individually. This approach enables researchers to build more accurate statistical models (Cernat, 2025).
Both waves of the survey were conducted by the Kyiv International Institute of Sociology. The first wave (January 18 – February 8, 2022) was a face-to-face survey (CAPI). It included 1,531 respondents, representing the Ukrainian population aged 15 and older living in government-controlled areas before the full-scale invasion. The response rate was 30.2%. The second wave (August 24 – October 6, 2022) was conducted by phone (CATI) and included 595 participants—39% of the original sample and 47% of those who had agreed to follow-up contact. The response rate in the second wave was lower among residents of rural and frontline areas, leading to a sample skewed toward urban populations and the western regions of Ukraine.
A detailed description of the panel study is available here, and thanks to an online app, anyone can explore how attitudes changed during the invasion. Using this data, we have already published research on shifts in religiosity during the full-scale war. In this article, we will highlight other important changes in Ukrainians’ attitudes, examine how exactly these changes unfolded, and attempt to explain why they occurred.
Trust in Times of Crisis
Among other things, war affects how people relate to one another—that is, it impacts social trust. Some studies suggest that trust decreases during such times. People withdraw into themselves, become less trusting of strangers, and more suspicious of those they see as “others”. This phenomenon is often described as post-traumatic detachment or an “us vs. them” response (Cassar et al., 2013; Rohner et al., 2013; Ingelaere & Verpoorten, 2020). At the same time, the solidarity and cohesion hypothesis—first proposed by Simmel—argues that a shared external threat can actually strengthen internal social bonds (Simmel, 1955; Stein, 1976). This idea is supported by some empirical research (Bauer et al., 2016; Gilligan et al., 2013).
In our study (see Figure 1), we observe precisely this dynamic: immediately after the invasion, the share of people who believe others are trustworthy and willing to help one another increased. Before the full-scale invasion, most respondents rated the honesty of others and their willingness to help one another at 4–6 out of 10. Seventy-five percent of respondents gave scores up to 6 for honesty and up to 5 for helpfulness (third quartiles: 6 and 5, respectively). After the war began, the distribution of responses shifted upward for both questions: high scores (7–10) became more prevalent, while low scores (0–3) noticeably declined.
In times of crisis, attitudes toward the state can also change significantly. Some studies show that citizens lose confidence in their government: if the state fails to protect them, this is perceived as a failure of the state itself (De Juan & Pierskalla, 2016; Grosjean, 2014). On the other hand, other researchers point to the rally around the flag effect—where people unite behind the government in the face of a threat (Mueller, 1970; Hetherington & Nelson, 2003). Citizens temporarily set aside political disagreements so as not to undermine the authorities’ ability to respond to the crisis. This is exactly what we observe in our data: following the start of the full-scale invasion, trust in the Verkhovna Rada rose significantly. Before the invasion, most respondents rated their trust in the Parliament at just 0–1 out of 10. After the war began, the distribution of responses shifted upward: a substantial number of ratings clustered around 3–7, the share of very low scores (0–1) dropped markedly, and the number of high scores (9–10) increased noticeably. A separate study conducted by the Kyiv International Institute of Sociology in December 2024 also shows rising trust in other political institutions—particularly the President.
Figure 1. Change in Trust Toward the Government and Other People During the War
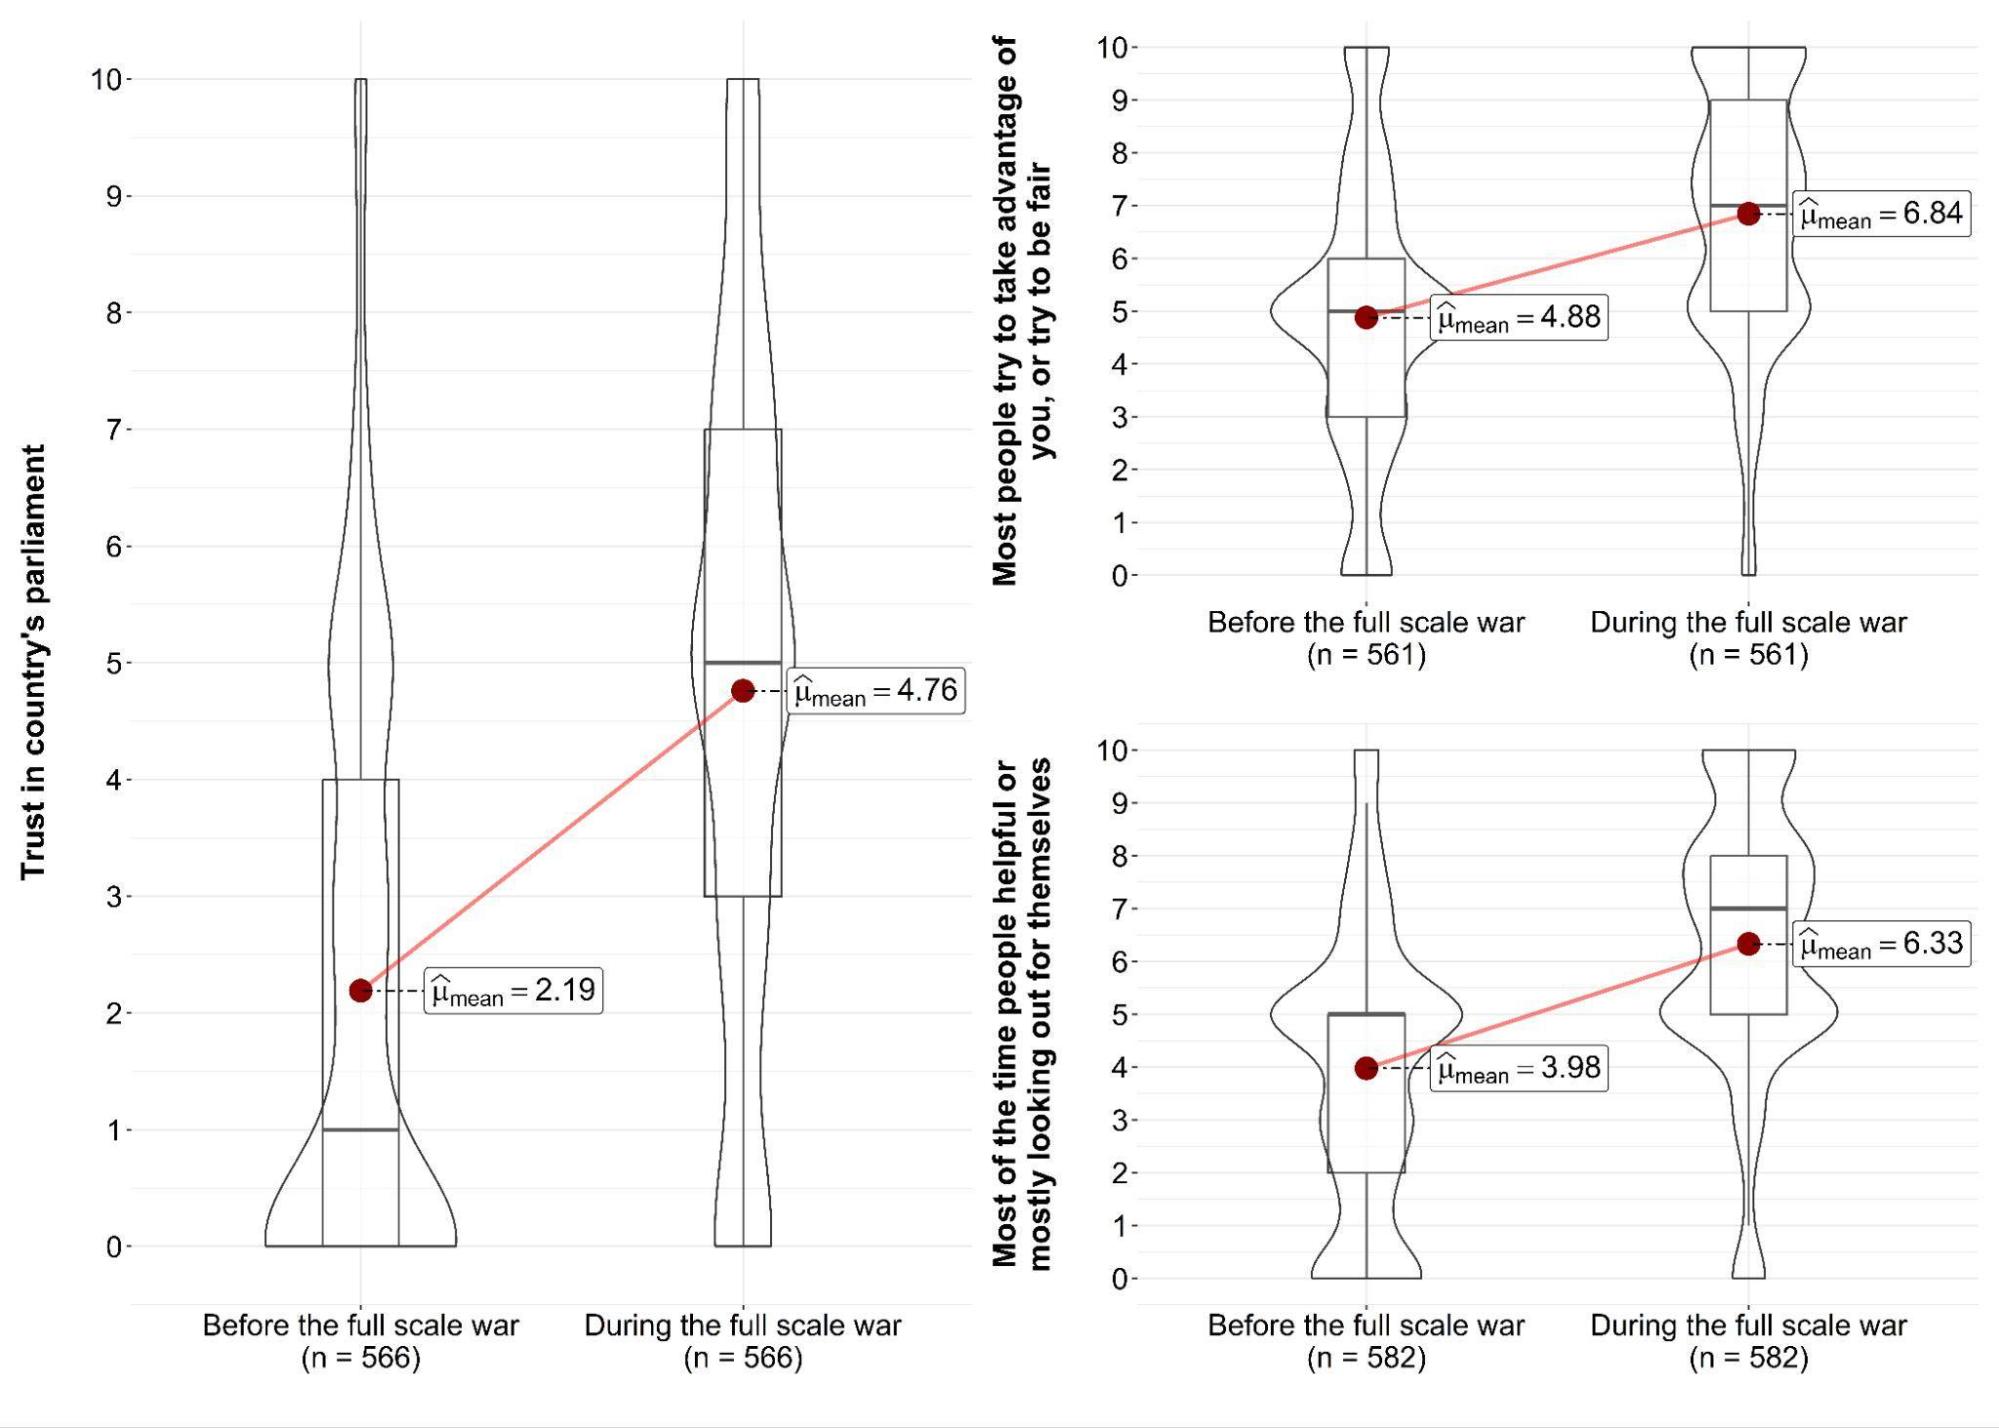
For the chart on the left: 0 = complete distrust in the Verkhovna Rada (Parliament), 10 = full trust in the Verkhovna Rada. For the charts on the right: 0 = expectations of dishonesty/selfishness; 10 = expectations of honesty/mutual assistance from fellow citizens. The rank biserial correlation coefficient for trust in Parliament is -0.76 [-0.70, -0.81]; for the belief that people are generally honest: -0.67 [-0.61, -0.72]; and for the belief that people are generally willing to help: -0.72 [-0.67, -0.77]. Square brackets indicate the 95% confidence interval. For more detailed explanations of the charts, see Appendix 1.
Authoritarianism? It’s Not That Simple
In addition to rising trust in government, the rally around the flag effect can also be accompanied by a rise in authoritarian attitudes—greater loyalty, obedience, and support for strong, centralized leadership. According to the theory of evolutionary modernization, in threatening conditions, people are more willing to limit their own freedoms if it increases the group’s chances of survival (Inglehart, 2018). Our panel data partially supports this: immediately after the invasion, respondents were more likely to agree that the country should show loyalty to its leaders (see Figure 2). Comparing the pre-invasion and wartime periods, we see that the share of low ratings (1–2 out of 5) decreased, while the number of mid-range ratings (3–4) increased slightly. At the same time, Ukrainians came to value democracy more highly. There was a noticeable increase in the share of maximum ratings (10 out of 10) for the importance of democracy during the war compared to the pre-war period.
Mikhail Alexseev and Serhii Dembitskyi explain this seemingly paradoxical trend using the concept of “geosocietal support for democracy” (Alexseev & Dembitskyi, 2024). The idea is this: when a democratic country is attacked by an authoritarian neighbor, people not only rally around their government—they also more strongly identify as citizens of a democratic state. In an effort to distance themselves from the aggressor country, led by a dictator, they come to value democracy even more. For some, democracy becomes part of their national identity—something they want to protect from the Russians.
Figure 2. Change in the Importance of Democracy and Loyalty to Leaders During the War
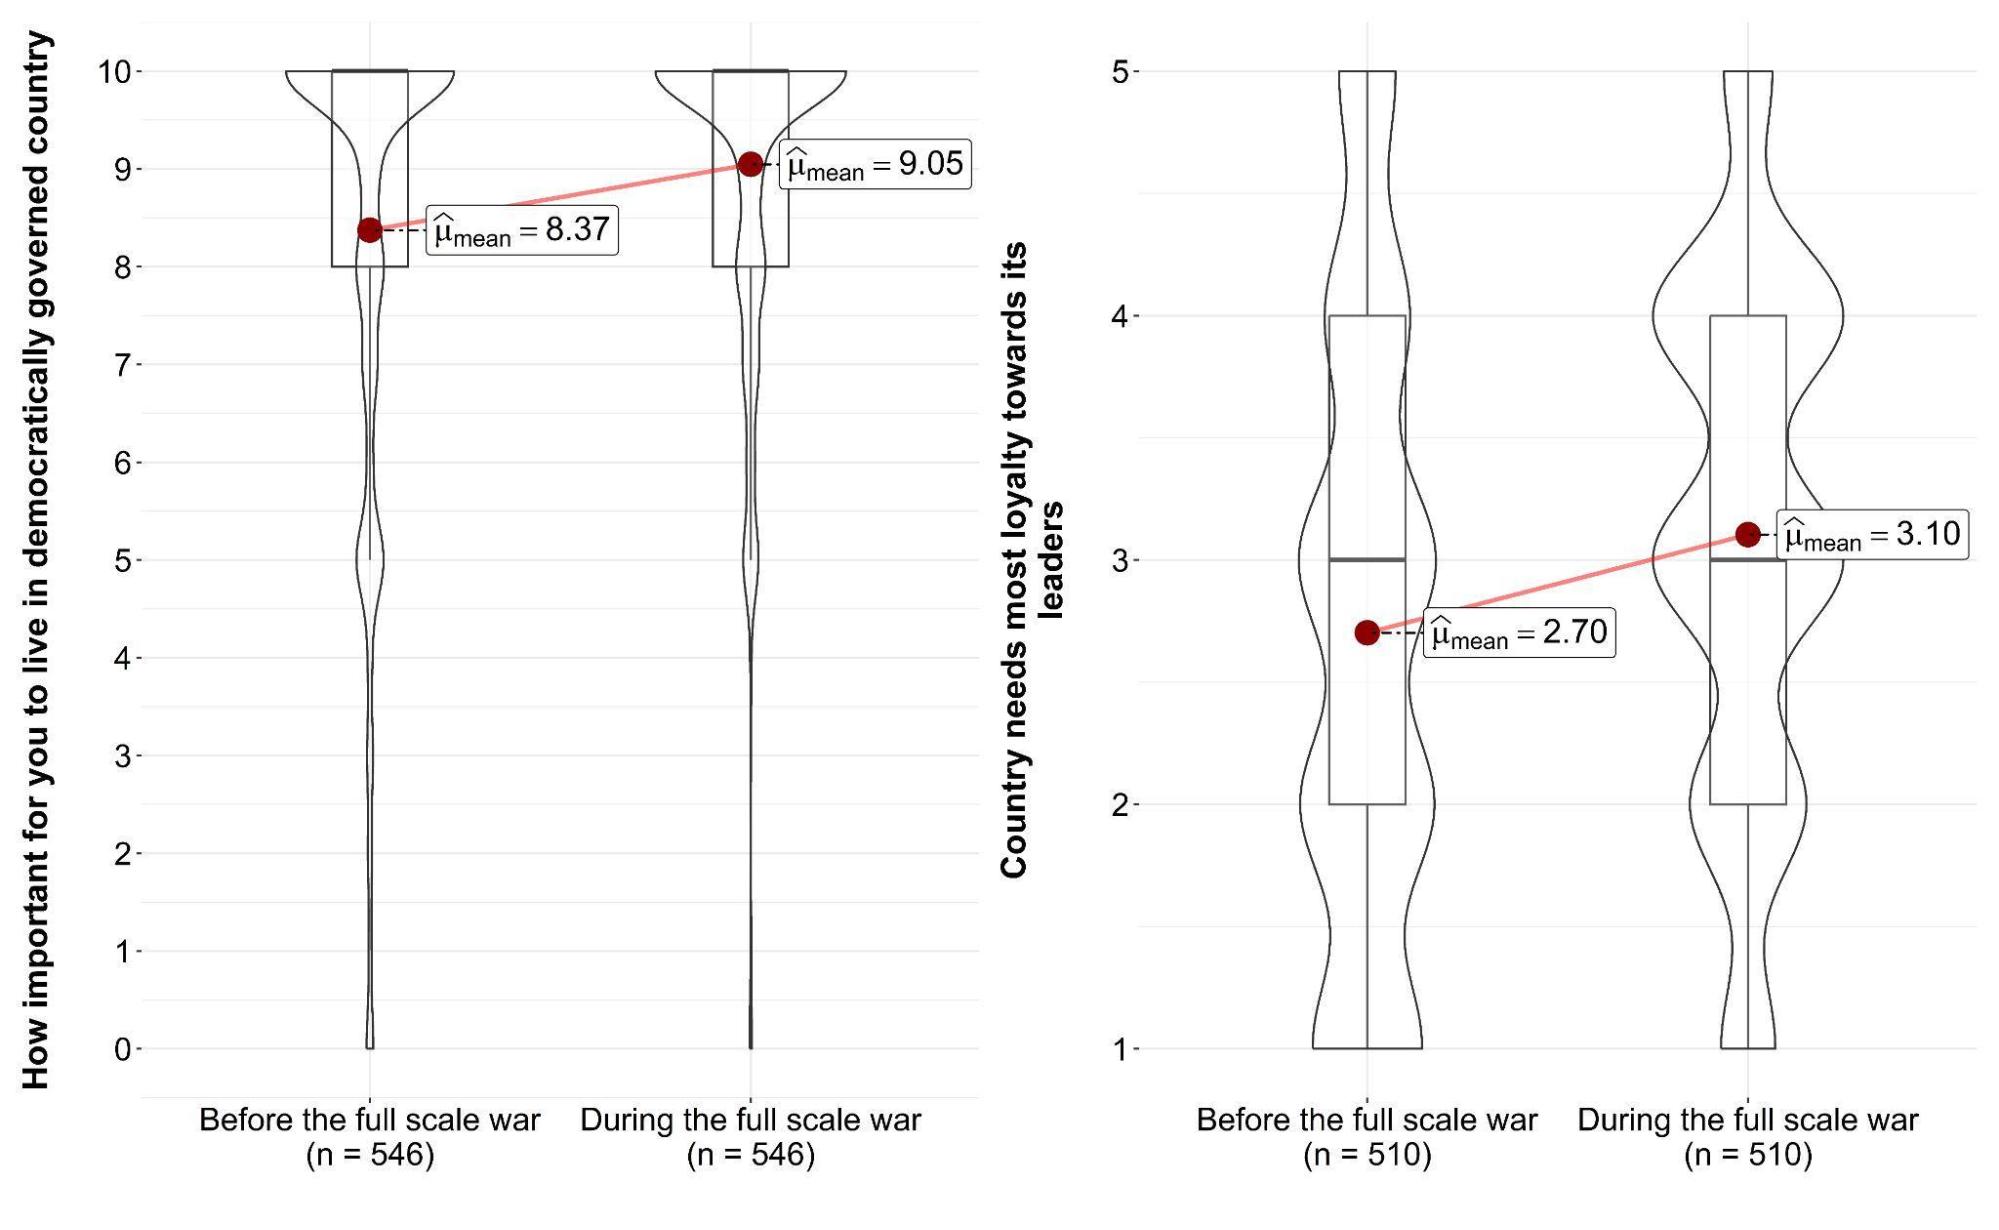
For the chart on the left: 0 = living in a country with a democratic system is not important at all; 10 = living in a country with a democratic system is very important. For the chart on the right: 1 = completely disagree that what Ukraine needs most is loyalty to its leaders; 5 = completely agree that what Ukraine needs most is loyalty to its leaders. The rank biserial correlation coefficient for the importance of democracy is -0.39 [-0.30, -0.47]; for loyalty to leaders, it is -0.36 [-0.27, -0.44]. Square brackets indicate the 95% confidence interval.
Happiness vs. Life Satisfaction: An Unexpected Divergence
It would seem that life satisfaction and happiness should move in tandem—both reflect how content a person is with their life and thus are indicators of subjective well-being. However, as we see in Figure 3, after the start of the full-scale invasion, life satisfaction among Ukrainians increased while reported happiness declined—a statistically significant difference. During the war, the share of very low life satisfaction scores (0–2 out of 10) decreased, while the density around mid-range values (around 5) increased compared to the pre-war period. In contrast, for happiness, the share of very high scores (9–10) declined, and the density of mid-range responses (around 5) increased.
The reason lies in the fact that these two indicators are not the same—they reflect different components of subjective well-being: cognitive and affective (Larsen & Eid, 2008; Pethtel & Chen, 2010). Life satisfaction is the cognitive component and reflects how people evaluate their lives overall. For example, in wartime, someone might think, “Things could be much worse,” and thus report higher satisfaction, even regardless of the terrible events happening. Happiness, on the other hand, reflects moment-to-moment emotional states, and war is unlikely to foster positive emotions—hence the observed decline.
Interestingly, the dynamic described above is not typical for most individuals. Only 12.4% of respondents experienced an increase in life satisfaction alongside a decrease in happiness. A noticeably larger share saw both measures change in the same direction—either increasing (25.2%) or decreasing (24.7%).
Figure 3. Change in Life Satisfaction and Happiness During the War
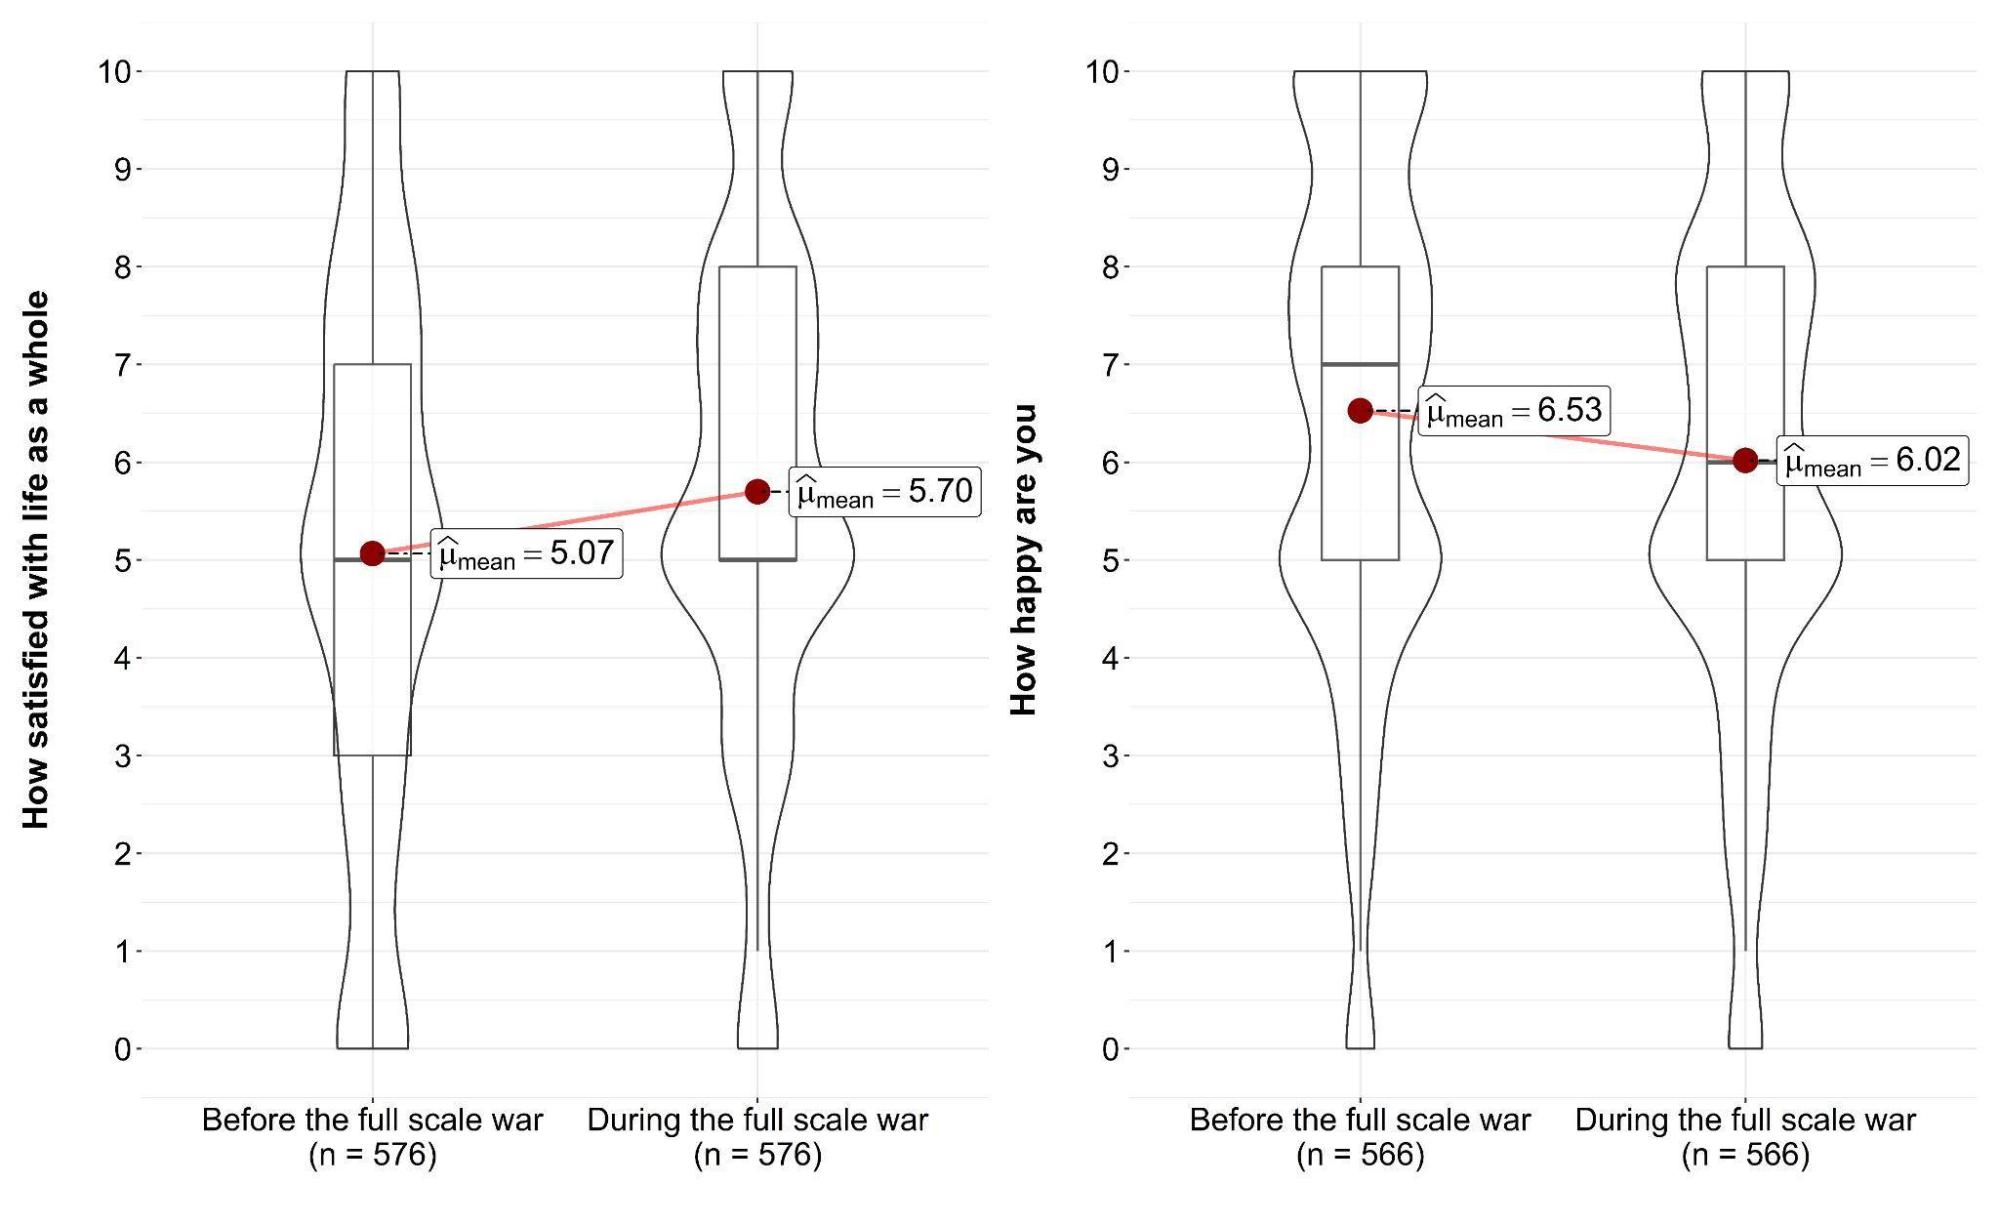
For both charts: 0 = not satisfied with life at all / not happy, 10 = completely satisfied with life / very happy. The rank biserial correlation coefficient for life satisfaction is -0.23 [-0.13, -0.32]; for happiness, it is 0.22 [0.12, 0.31]. Square brackets indicate the 95% confidence interval.
So What?
This article explored three dimensions of Ukrainians’ lives that changed at the onset of the full-scale invasion: trust, democratic attitudes, and subjective well-being. Why does this matter?
Trust. In Ukrainian media, there is a common belief that war undermines trust between people (see, for example, Tamilina, 2025). But our data tells a different story: immediately after the invasion, interpersonal trust actually increased. This suggests that war’s impact is not one-dimensional—alongside the pain and suffering that can erode trust, there is also a force of national unity that can foster it. To draw firm conclusions about the long-term effects of war on trust, we need to observe which of these forces ultimately proves stronger.
Democratic attitudes. The fact that support for democracy grows when a country faces an authoritarian threat suggests that the legitimacy of democracy can be reinforced not only by economic success and strong institutions but also by contrasting oneself with a “tyrannical enemy.” As Mikhail Alexseev and Serhii Dembitskyi rightly note, this same mechanism can also work in reverse (Alexseev & Dembitskyi, 2024). If anti-American resentment were to spread in Ukraine—say, triggered by Donald Trump’s foreign policy—the perceived value of democracy (provided we still consider the U.S. a democratic regime) could decline. This risk should remain on our radar if we aim to strengthen and protect the democratic order.
Subjective well-being. Subjective well-being plays a key role both in understanding a person’s psychological state and in assessing social processes. It correlates with mental health, including manifestations like stress and anxiety (Satici, 2016). Higher levels of subjective well-being are associated with greater resilience and stronger social trust. For example, Ukrainians who reported higher levels of well-being during the war also exhibited higher individual, social, and community resilience (Kimhi et al., 2023). Data from the European Social Survey also shows that well-being is a predictor of trust in others (Glatz et al., 2022). Studying subjective well-being during wartime—its factors and consequences—helps us better understand how people live under conditions of uncertainty and danger, as well as assess the effectiveness of psychological support and social programs. It is essential to treat life satisfaction and the sense of happiness as distinct components of well-being, as they may respond differently to the same influencing factors. In particular, LIWS data show that the war affects these two indicators differently.
LIWS Open Access to LIWS Data
So, who are the people whose life satisfaction and sense of happiness actually increased during the invasion? Why did some come to value democracy more deeply while also believing that, in wartime, society should show greater deference to its leaders? And who remained untouched by the “rally around the flag” effect—whose trust in the government did not increase? To help you explore these and other questions yourself, we have made the LIWS data publicly available. At the provided link, you will find a brief description of the study, a codebook, and full datasets.
We invite colleagues to join in analyzing the panel data: the more researchers who engage with LIWS, the better we will understand how Ukrainian society is transforming under the greatest military threat of the 21st century. To seize this unique opportunity, we are already planning future waves of the survey and are currently seeking partners to help fund them. If you are interested in getting involved, please contact our research team at [email protected].
Appendix 1. Data Analysis Strategy and Explanation of the Charts
We compared the distributions of responses from the same individuals at two points in time—before and during the full-scale invasion. Differences between the distributions were assessed using the Wilcoxon test. All reported differences are statistically significant at the 0.05 level. The rank biserial correlation coefficient is a measure of association between a dichotomous variable (in our case, the survey wave) and an ordinal variable. Its values range from -1 to 1, where 0 indicates no difference between the two waves on the ordinal variable. If the 95% confidence interval includes 0, the coefficient is not significantly different from 0. The sign of the coefficient shows which wave had higher ordinal values: a positive coefficient points to higher values in the first wave and a negative one—in the second wave. The absolute value of the rank biserial correlation reflects the magnitude (strength) of change over time: the larger the value, the more pronounced the change. The coefficient values and their 95% confidence intervals are provided in the notes below the charts.
The distributions are visualized using a combination of two common chart types—the boxplot (also known as a box-and-whisker plot) and the violin plot. Each “violin” shows how frequently respondents selected particular ratings: the wider sections of the plot indicate a greater number of responses for that specific score. The light-colored rectangle inside represents the boxplot. 25% of respondents’ answers with the lowest values fall below the bottom line of the box, and 25% of the highest responses are above the top line. The line inside the box marks the median of the distribution. The “whiskers” extending from the box show the minimum and maximum values in the data that are not considered outliers. Red dots indicate the mean values of the distributions.


Attention
The authors do not work for, consult to, own shares in or receive funding from any company or organization that would benefit from this article, and have no relevant affiliations