In 2010 respondents in Ukraine suffered from much higher (5.6% to 19.6% points) perceived corruption and much higher (28.6% to 41.9% points) reported corruption levels for four main public services compared to other (mostly transition) countries. However, after the Revolution of Dignity Ukrainian respondents in 2016 noted statistically significant reduction in corruption levels for interacting with road police (11.6% points lower perceived and 27.7% points lower reported corruption) and receiving treatment in public health facilities (14.7% points lower perceived and 12.8% points lower reported corruption). These substantial reductions in corruption are discussed in the context of reforms since 2014.
Brief history of corruption
Many countries in Eastern Europe, including Ukraine, have been characterized by high levels of corruption in the early period of transition in the 1990s. Corruption can take many different forms starting from oligarchs who “privatize” for free a former state-owned factory to a local police officer who takes a bribe instead of issuing a traffic ticket. Even physicians or school teachers in public facilities may take informal payments or gifts in exchange for the service.
Unfortunately, all of the above listed types of corrupt activities, from the very top political circles to local public service providers, have been widespread in Ukraine. “Petty” corruption in Ukraine has deep roots in soviet history. For example, a young physician (after at least 6 years of intensive studying in a medical school) could be earning 120 soviet rubles while a factory worker (right after high school) would make 300 rubles per month. A popular joke even said that a good physician did not need a salary because grateful patients would provide it. In addition, in the 1990s official salaries in the public sector lost almost all of its value due to high inflation, often forcing public servants to accept bribes as the only way of survival
After the Revolution of Dignity in 2014 the demand for reforms, including the fight against corruption, was high. Current project uses 2010 and 2016 waves of “Life in Transition” which is a nationally representative survey of Ukraine and other transition countries conducted by the European Bank for Reconstruction and Development and the World Bank. By using two waves of the survey (before and after the Revolution of Dignity) it is possible to analyze the change in corruption levels. The analysis is supplemented by socio-economic and socio-demographic characteristics of respondents to have a better picture of who is more likely to make an informal payment and why.
Changes in perceived and reported corruption
This study considers changes in corruption for 4 main public services: interacting with road police (Figure 1), requesting official documents from authorities (Figure 2), receiving primary or secondary public education (Figure 3) and receiving medical treatment in the public health system (Figure 4).
The left panel of each of Figures 1-4 shows perceived corruption indicating a respondent’s opinion on how frequently people make unofficial payments for each of the 4 public services. The right panel of each Figure shows the self-reported corruption only for those respondents who used a particular service. To give one example, in 2010 9.2% of 1,559 respondents in Ukraine believed that people like them always made an unofficial payment when interacting with the road police. In the same year, only 267 respondents (or their household members) interacted with the road police and 70.4% of them made unofficial payment or a gift.
Figure 1. Changes in perceived and reported corruption in Ukraine between 2010 and 2016 when interacting with road police.
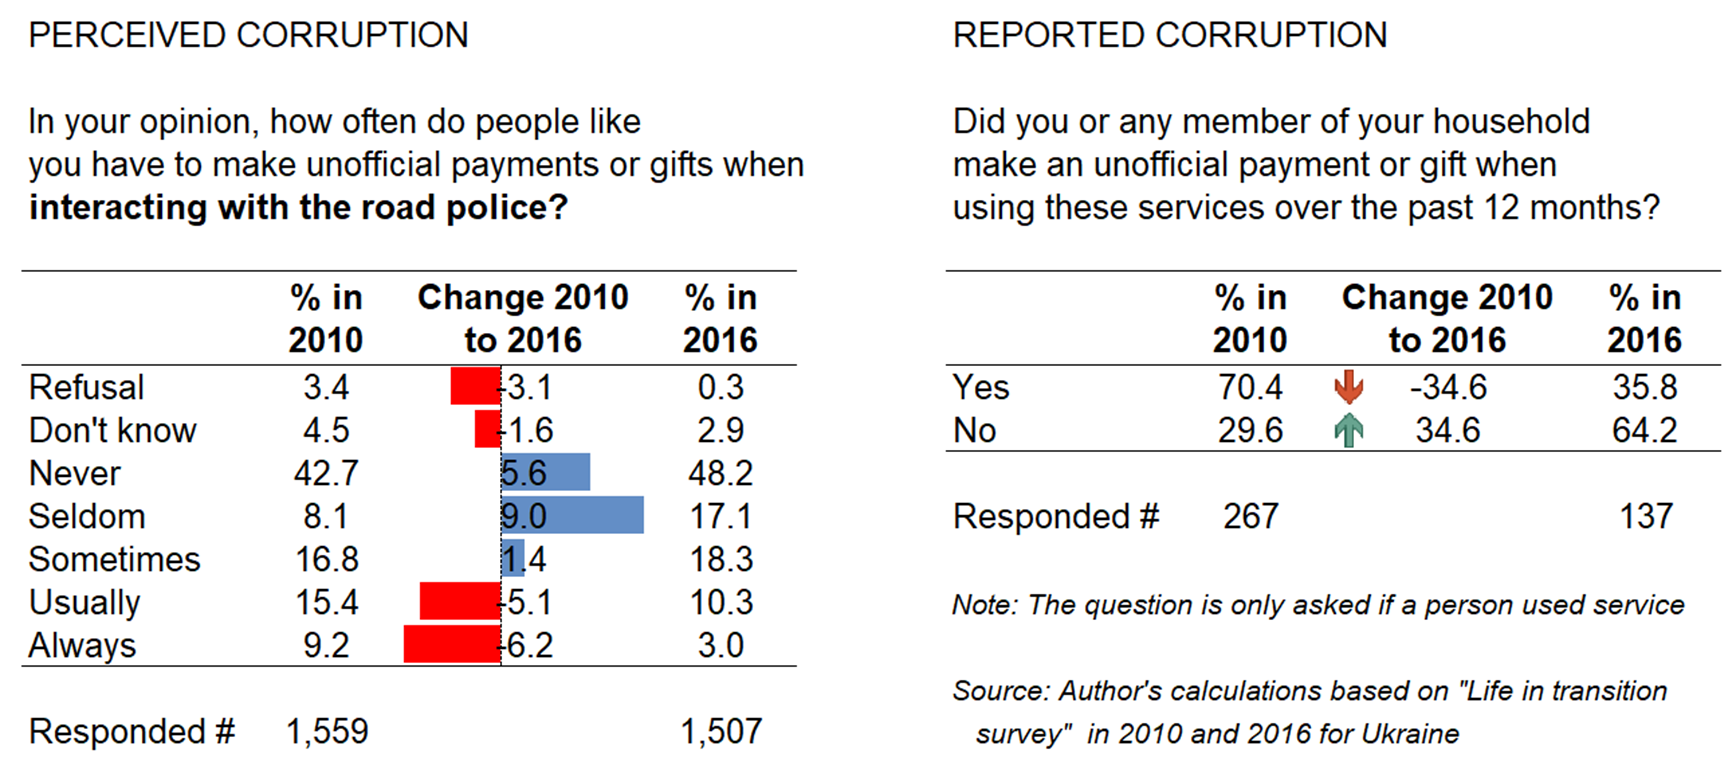
Figure 2. Changes in perceived and reported corruption in Ukraine between 2010 and 2016 when requesting official documents from authorities.

Figure 3. Changes in perceived and reported corruption in Ukraine between 2010 and 2016 when receiving public education.
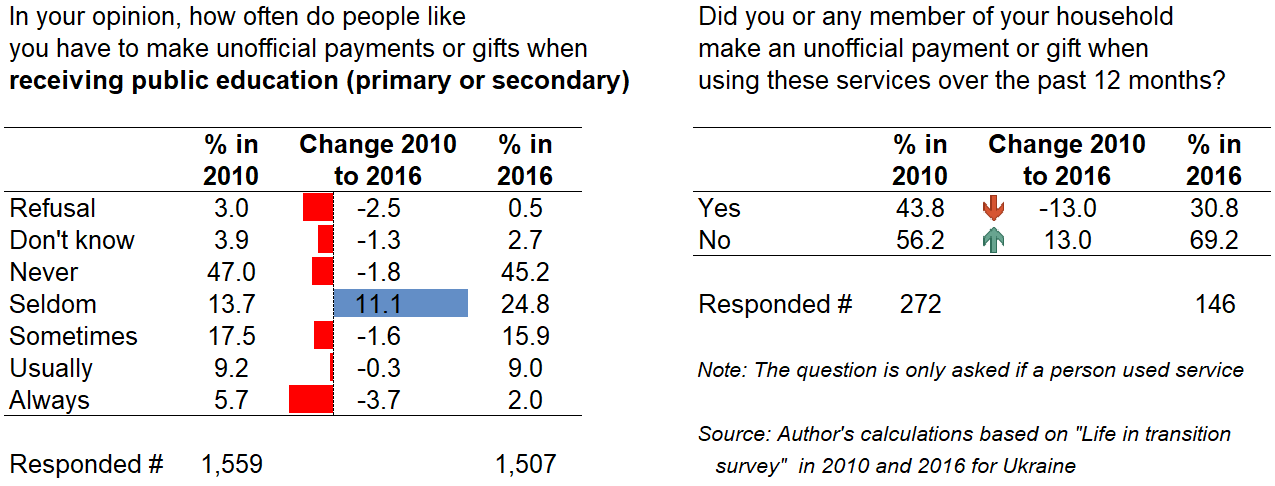
Figure 4. Changes in perceived and reported corruption in Ukraine between 2010 and 2016 when receiving medical treatment in the public health system.

The results clearly indicate that after the Revolution of Dignity both perceived and reported corruption substantially decreased in Ukraine. For example, the percent of people who believe that interacting with public officials “Usually” or “Always” results in an unofficial payment reduced for all 4 services between 2010 and 2016. Likewise, the percent of users of public services who made an unofficial payment fell from 70.4% in 2010 to 35.8% in 2016 for those who interacted with road police, from 32.5% to 24.6% for those who requested official documents, from 43.8% to 30.8% for those who received public education and from 52.6% to 33.9% for those who received medical treatment in the public health system. These numbers indicate a huge reduction in corruption as Ukrainians clearly confirmed their European choice after 2014.
Determinants of reduction in corruption
An attentive reader has probably observed that the number of users of all 4 public services has declined between 2010 and 2016. One plausible explanation could be that users dissatisfied with the quality of public education and health care could have switched to private providers of the corresponding service. If the users who switched were more likely to pay a bribe (because, for example, they could afford it) then it could explain the reduction in corruption. But the number of users also reduced for the two other public services that do not have private alternatives, namely, requesting official documents and interacting with road police. Hence, it is also possible that sample composition has changed. In order to control for such a possibility let’s now consider the models that also account for personal socio-demographic and socio-economic characteristics in Table 1.
Previous results do not control for possible changes in sample composition, and we would also like to compare Ukraine to other countries. Hence, let’s consider a difference-in-differences model estimated with respondent weights, robust standard errors and clustering at primary sampling units. Perceived corruption and reported corruption were turned into binary variables so that coefficients can be interpreted as percentage changes. For perceived corruption there are up to 1,559 (1,507) observations in 2010 (2016) for Ukraine and 37,305 (49,699) for other countries. For reported corruption there are fewer observations (because it is asked only of users of a service) which differ by services.

Models indicate that in 2010 respondents in Ukraine suffered from much higher (5.6% to 19.6% points) perceived corruption and much higher (28.6% to 41.9% points) reported corruption levels compared to other (mostly transition) countries in the sample. However, in 2016 Ukrainian respondents noted statistically significant reduction in corruption levels for interacting with road police (11.6% points lower perceived and 27.7% points lower reported corruption) and receiving treatment in public health facilities (14.7% points lower perceived and 12.8% points lower reported corruption). The coefficients for requesting official documents and receiving public education are also negative but not significant (potentially due to small sample).
It is of interest to discuss the findings in the context of a number of reforms introduced after 2014 – how the results align with the timing of the reforms? The results are expected for interacting with road police when newly trained police officers with a substantially higher salary replaced the old corrupt police soon after the Revolution of Dignity. Centers for administrative services which reduced corruption in getting official documents appeared before 2014 so it is not surprising that effects are not statistically significant. Salaries of teachers increased by only 10% in December of 2015 so no significant reduction in corruption was either expected or observed. The most unexpected result is the reduction in corruption in public health care because serious reforms and salary rises in public health care started only in 2017. This result may be driven by a reduction in the use of public health care because of users switching to private providers or pharmacies. For example, more affluent patients could switch to private clinics and poorer patients (who can’t afford it) could just buy medications from a pharmacy instead of visiting a doctor.
It is also of interest to discuss the effects of other variables in the sample of all countries. Both perceived and reported corruption tend to be higher for bigger households, those who are better educated and with improved living conditions. Households with children and older adults as well as those having a car, a computer and internet tend to report lower perceived and actual corruption. What is also interesting, there is no systematic difference between rural and urban households (except for 2 statistically significant but rather small coefficients with opposite signs). In particular, rural respondents reported 2.2% points higher probability of informal payment for obtaining an official document and 3.3% points lower probability of unofficial payment in public education.
Concluding remarks
The full-scale Russian aggression of 2022 revealed an enormous gap in values between Ukrainian citizens and occupiers. A natural question is why and how Ukraine managed to move away from a terrible Soviet past with its total corruption toward a more civilized European model? This study indicates major reduction in corruption between 2010 and 2016 for four main public services. Of course, it would be naive to say that corruption is eradicated in Ukraine given a number of recent scandals. However, this pressure for positive changes in reducing corruption is an important part of Ukrainian identity quickly departing from the times of Kremlin domination.
This work was presented at Tulane Freeman Ukrainian Speaker Series (TFUSS) on January 13th, 2023. The findings presented are those of the author and do not represent the views of TFUSS which provided financial support but wasn’t involved in study design and implementation.
Attention
The author doesn`t work for, consult to, own shares in or receive funding from any company or organization that would benefit from this article, and have no relevant affiliations