Creating an ATC with a population of more than 5,000 residents increases the per capita income from an individual’s unified tax o by 4.9%. This may be due to the increased confidence of entrepreneurs in the administration of their taxes and the confidence that central government will not be able to interfere with the local decision-making process. At the same time, the increase in the proceeds from the subvention for socio-economic development does not stimulate growth of unified tax revenues from both individuals and legal entities.
On December 9, 2019, Chairman of the Verkhovna Rada Dmytro Razumkov declared that the decentralization reform could be completed in the near future. The law on the simplification of ATC formation plans and guidelines for assessing the capacity of ATCs were adopted for this matter. These regulations will make it possible to forcibly amalgamate communities that have not voluntarily amalgamated yet. In our opinion, in order to better complete the reform, it is worthwhile to analyze the experience gained from the ATCs already created, in particular, in terms of tax revenues.
It is widely believed (and reflected in the Community Capacity Assessment Guidelines) that ATC is as capable as the greater its quantitative parameters: population size, area, and budget revenues. This is based on the logic of the effect of scale and concentration of resources.
However, according to the concept of peer pressure in the behavioral economics, ATC with smaller-scale population, can easier raise additional tax revenues. In such ATCs, it is more obvious how taxes are used. Therefore, there is a need to pay them transparently. This is made possible by engaging community residents in budget discussions.
Nobel Laureate in Economics Roger Meyerson says that under centralization, residents have less incentive to pay taxes than under decentralization, since tax evasion is the only mechanism to “punish” authorities appointed “from above” if they do not provide public goods properly.
In Ukraine, trust in local government has always been higher than trust in central government. This is evidenced by surveys of various organizations: KIIS, Razumkov Center, Social Monitoring. Studies allow us to explain this phenomenon. Altruistic behavior is more widespread if there is less anonymity in society (Locey and Rachlin, 2015). People have limited access to keeping up social connections (Hill, Dunbar, 2003). Accordingly, the smaller the newly created community by population, the less anonymity it has, and the stronger the social ties that discourage tax evasion if people receive good public goods in return.
Therefore, the optimal community size is a balance between the scale effect (which saves money) and the social trust that is based on social ties (which allows residents to feel more responsible for the community’s share and therefore encourage taxes).
In Europe, the focus has recently been on optimizing local government spending. However, studies show that community enlargement in EU countries does not lead to the expected scale effect (Roesel, 2017).
We tested the hypothesis that the size of an ATC has an impact on the tax revenue in the example of a unified tax in ATCs’ budgets.
It turned out that:
- the revenues (per capita) from these taxes increase after the creation of an ATC
- this growth is greater for smaller communities (less than 5,000 residents)
The essence of decentralization reform
In 2014, the Government launched reform on decentralization of power, involving the transfer of financial resources and powers in various sectors from higher levels of government to the levels of village, town and city councils. Within the framework of decentralization ATС’s new opportunities have emerged. First of all, this is a direct relationship with the State budget: there are no longer additional “filters” for regional and district budget revenues; ATC budget has direct subventions from the state budget and an expanded revenue base through the receipt of 60 percent of the personal income tax, part of rent payments and excise taxes. Thus, ATCs are interested in developing businesses in their territories, as this will mean an increase in tax revenues. In turn, this will have a positive impact on the provision of public services and allow ATC leaders to earn “electoral points”.
Amalgamated territorial communities are formed through the voluntary integration of neighboring communities or the voluntary affiliation of villages or small towns to communities of cities of regional significance. One of the basic conditions of voluntary association is to prevent the deterioration of the quality of public services provided by the amalgamated territorial communities. The chairman of the ATC and council members formulate local policies, areas of community development, budget expenditures in accordance with residents’ expectations. These policies apply to the daily life of the community, such as improving school conditions, establishing a local solid waste management system, etc.
Over five years, more than 4,000 villages, towns and cities have been voluntarily united in more than 1,000 ATCs. However, today there are discussions in the circles of experts and government officials about the possibility of reformatting already established communities (for example, 1, 2, 3).
ATC’s tax revenues have the structure shown in Figure 1.
Figure 1. Distribution of consolidated income of ATC (general and special fund) by articles in 2017, %
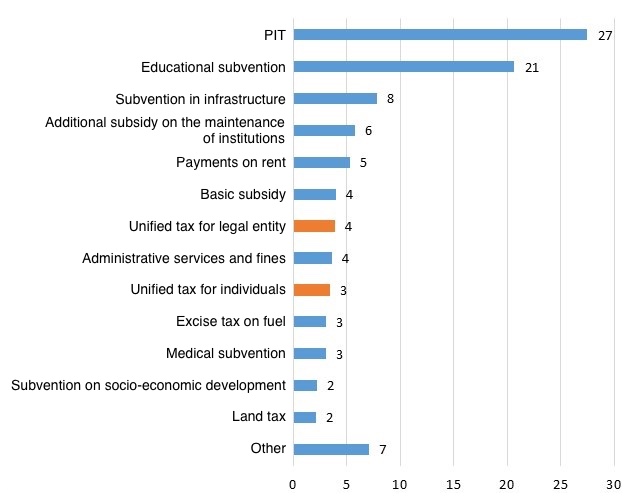
In 2017, the unified tax on individuals amounted to 3.4% of the income of ATC, while the tax on legal entities – 0.6% (Fig. 1 added a unified agricultural tax to the unified tax on legal entities). Despite the rather moderate share of the unified tax on individuals and legal entities in the structure of community income (4% cumulatively), we decided to analyze it, since it reflects the economic activity in the community. In monetary terms, the unified tax on individuals, paid in all communities in 2017, amounted to UAH 651 million, and the single corporate tax – UAH 111 million.
To determine how hromada creation affects unified tax revenue, we analyzed the 2014-2017 income and expenditure of settlements. To compare community revenues and expenditures before and after the amalgamation, we grouped the community budgets before the ATCs were created according to how they amalgamated into communities later.
In fact, we have paid attention to how the change of status from a group of non-amalgamated territorial communities to amalgamated territorial communities has affected the change in the unified tax revenue. More methodology can be found in the appendix.
It is evident from the data that in 2014, in the settlements where the ATCs were created, there was a higher income from a unified tax on individuals. However, after the creation of ATCs they began to grow even faster. In addition, the growth is the fastest among small ATCs (Fig. 2).
Figure 2. Dynamics of median income from a unified tax on individual entrepreneurs per capita (in UAH 2014) in terms of the fact of the creation of an ATC, year of creation and size
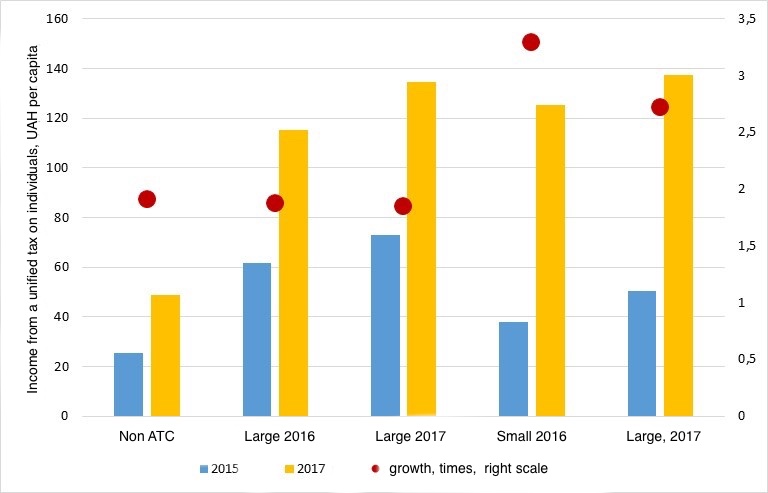
Note: on the chart “large ATCs” – more than 5000 inhabitants, small ones – less than 5000. 2016 and 2017 – years of ATC creation
The results of the evaluation showed that the formation of an ATC differently influenced the change in the unified tax revenue for hromadas of different sizes. Creating a community with a population of less than 5,000 inhabitants increases the per capita income from a unified tax on individuals by 16.1% compared to settlements where there is no ATC. At the same time, if more than 5,000 people live in the newly created community, then its formation increases the per capita income from a unified tax on individuals by only 4,9% compared to settlements without ATC.
For the unified legal enitites tax, the situation is different. Establishing a community with a population of less than 5,000 residents increases the per capita income of this tax by 2.3% compared to non-community settlements. The formation of a community with a population of more than 5,000 residents does not affect the unified tax for legal entities (Table 1).
Table 1. Main results of the model
| Impact factor | Unified tax of individuals | Unified tax of legal entities per capita |
| Creating a community with a population of less than 5,000 | +16,1% | +2,3% |
| Creating a community with a population of more than 5,000 | +4,9% | negligible effect |
The increase in tax revenues after the creation of an ATC may have several explanations.
First, it is possible that, following the voluntary process of creating an ATC, residents are more likely to trust the local government (council) and, accordingly, to avoid tax evasion. At the same time, the smaller the community, the greater the residents’ trust in local government, because it is easier to control how the money is spent by the community authorities.
Second, hromada creation could revitalize economic activity, especially if community authorities were taking some steps to attract investment. For the same reason, entrepreneurs from other settlements where communities are not created could be re-registered to the ATC.
Third, ATCs could raise unified tax rates for Group 1 and Group 2 individual enterprises. According to the Tax Code (Article 293) for the 1st and 2nd group of individual enterprises the unified tax rate is determined by local self-governments within the limits of up to 10% for the first group and up to 20% for the second.
We sent out sample requests to 48 ATCs and 30 village/township councils, uniformly distributed across Ukraine’s regions, to find out what unified tax rates they set for Group 1 and Group 2. It turned out that the vast majority of ATCs, as well as villages and townships, set the highest possible rates: 10% for Group 1 and 20% for Group 2. Moreover, the majority of ATCs did not change rates in 2016-2017.
The sample is not representative because it has few observations, but it does show that the increase in unified tax revenue from ATCs is unlikely to be associated with a change in rates. By the way, there is an example of Mlynivska ATC, which has set these rates at 1% since 2020, expecting more entrepreneurs to register. However, this is rather an exception than the rule.
The analysis of the data also showed that the subvention on socio-economic development obtained in the previous year does not affect the unified tax revenue. This means that this subvention does not stimulate the economic development of the territories, despite its purpose.
In addition, subvention for socio-economic development is usually distributed politically, to those regions where local governments are loyal to the central government or MPs, elected from these regions, are members of the coalition. They often spend it on the various “small things” on which they arrange political PR, although this money could go to infrastructure projects needed for business development.
Conclusions, recommendations and discussion
Our research shows that after voluntary amalgamation of territorial communities, entrepreneurs begin to pay more taxes. This may be due to the revival of entrepreneurial activity, the re-registration of individual entrepreneurs to ATCs from other settlements, or the exit of businesses from the shadows. In any case, this indicates greater trust in local authorities where residents voluntarily united in the community. The increase in tax revenues is higher in smaller communities, which may indicate a “social ties effect”. A separate study is required to verify the presence of the scale effect.
In addition, our study showed that the receipt of a subvention on socio-economic development in the previous year does not affect the economic activity of unified tax payers in the current year. That is, a subvention that is supposed to stimulate the economic development of the territories does not fulfill this function. The Ministry of Finances has tried to abolish this subvention for several years. But majoritarian MPs refused to do so.
Decentralization is not so much about the amount of money, it is about the powers of local authorities and communities to dispose of them. In doing so, a balance must be sought between economies of scale (because small communities are not always able to provide the right amount of services) and the strength of social connections in the community and the involvement of residents in decision-making. Newly formed communities are currently learning to make decisions based on different interests. It is important to minimize the involvement of central government in this process, in particular for a while to abandon the idea of reformatting already established communities. This will destroy trust not only within communities but also to the central government
Appendix. Expanded methodology of estimation
In order to calculate the effect of ATHs on tax revenues, we have taken data from local budgets for 2014-2017, as well as data on population of settlements for 2018. For 2014, we had data on local budget revenues and expenditures for the 11 months of the year (January to November inclusive).
For the sake of comparison, we have designed the 2014-2015 revenues and expenditures of “prototypes” of communities created in 2016 as the sum of revenues and expenditures of the settlements that have been included. In the same way, we did according to 2014-2016 data on “prototypes” of communities created in 2017.
The dependent variable of our study was the tax revenue from a unified tax for individuals per capita, as well as from legal entities per capita.
The main independent variable was a categorical variable, equal to 1 for the designation of the ATC or 0 for the designation of the “prototype” of the hromada prior to its creation or simply settlements. We divided it into two categorical variables: the designation of ATC with a population of less than 5,000 inhabitants and the designation of ATC with a population of more than 5,000 inhabitants.
The other independent variables are:
- per capita revenues from transfers from the state budget (basic grant, stabilization grant, subvention for socio-economic development) in the previous year. On the one hand, they can stimulate economic activity and, on the other, stimulate settlements or ATCs to wait for funds to come from above, instead of working with local people and businesses, learning about their needs and persuading them out of the shadows.
- expenditures of local budgets per capita in the previous year on subsidies and transfers to enterprises (“Subsidies and current transfers to enterprises (institutions, organizations)”, “Capital transfers to enterprises (institutions, organizations)”). When businesses get more money, they can produce and sell more products at more competitive prices. This way, they can pay more in sales taxes.
- local budget expenditures per capita in the previous year for capital expenditures or development expenditures (“Research and development, separate measures for implementation of state (regional) programs”, “Capital construction (acquisition)”, “Capital repairs”, “Reconstruction and restoration” ).
These expenditures could improve infrastructure, which could increase economic activity. On the other hand, economic activity could be revived by the fact that the local government ordered services from the budget from the enterprises (including the next year). In either of these cases, this type of spending in the previous year increases tax revenue in the following year.
For all variables expressed in money, we used logarithms, previously adding 0.1 to those variables that contained zero observations.
We excluded settlements with a population of more than 50,000 inhabitants, as well as data where the dependent variable was less than the 1st percentile or more than the 99th percentile.
Thus, we obtained unbalanced panel data. Due to logs, we lost 1 year of observations. Accordingly, the panel contains years from 2015 till 2017.
We used the two-way fixed effect method and robust standard errors to build the model.
To analyze the dynamics of the single tax revenue from the ATC budget, depending on their size, we took into account only the ATC population. Another parameter to the size of an ATC that may be related to the tax revenue to the ATC budget is the area of its territory. Further studies, in addition to estimation of the effect of scale, should also analyze how the compactness of the ATC (area and density of settlements, distance to the ATC center from other villages and settlements) can affect tax payments. Social networking is clearly influenced by the distance between the settlements of the ATC, and thus also by the possibility of social control.
| Variables | The coefficient and the standard error from the model to the single tax on natural persons | The coefficient and the standard error from the model to the single tax from the legal entities |
| Creating an ATCwith a population of more than 5,000 | 0.049***
(0.011) |
0.002
(0.010) |
| Creating an ATC with a population of less than 5,000 | 0.161**
(0.015) |
0.023*
(0.013) |
| Stabilization dotation per capita in the previous year | 0.006***
(0.002) |
0.002**
(0.001) |
| Subvention for socio-economic development per capita in the previous year | 0.007
(0.009) |
0.004
(0.006) |
| Basic dotation per capita in the previous year | 0.050**
(0.020) |
0.041***
(0.014) |
| Subsidies and current business transfers per capita in the previous year | 0.120***
(0.022) |
0.096***
(0.016) |
| Expenditure on research and regional programs per capita in the previous year | 0.038***
(0.007) |
0.011**
(0.005) |
| Capital expenditure per capita in the previous year | 0.024***
(0.006) |
0.018***
(0.004) |
| Capital repairs per capita in the previous year | 0.017***
(0.003) |
0.005**
(0.002) |
| Costs for reconstruction and restoration per capita in the previous year | 0.025***
(0.006) |
0.017***
(0.004) |
| Expenditure on capital transfers to enterprises, institutions, organizations | 0.091***
(0.016) |
0.049***
(0.011) |
| Number of observations | 25346 | 25346 |
| R2 | 0,054 | 0,043 |
* – coefficient significant at 90% confidence interval, ** – coefficient significant at 95% confidence interval, *** – coefficient significant at 99% confidence interval


Attention
The authors do not work for, consult to, own shares in or receive funding from any company or organization that would benefit from this article, and have no relevant affiliations