The development of agriculture and rural areas is an extremely important element in Ukraine’s economic development because the agro-industrial complex generates around 20% of the country’s GDP and nearly 50% of foreign currency earnings, with rural areas being home to a third of the entire population of Ukraine. Currently, however, a significant share of agricultural production is “in the shadows”, which certainly affects both the agri-food sector and rural development. Furthermore, a significant part of legislative initiatives now aims to reduce underground transactions with agricultural products. In this article, we try to gauge the impact of the shadow sector on agriculture and rural development.
In this article, we use the following indicators to assess agriculture and rural development:
- For rural development, we use expenditures on public goods in rural areas as an important rural development indicator (GENERAL SERVICES SUPPORT ESTIMATE (GSSE) from the OECD). This is indirect support to agriculture through investment in rural infrastructure, agricultural training and education; development of the health care system for animals, plants and humans (sanitary and phytosanitary measures) etc.
- For agricultural development, we use productivity, namely total factor productivity (TFP), which takes into account the productivity of all factors of production as a whole rather than individual components, e.g. crop or labor productivity (Agricultural TFP index from USDA).
Productivity and expenditures on public goods are widely used to analyze agricultural and rural development since they are associated with living standards and economic growth. Productivity is the main driver of agricultural growth as well as an indicator of efficiency and competitiveness. Public goods expenditures play a key role in the agricultural sector and rural areas since they contribute to efficiency and positively affect the residents’ income levels, quality of life, etc.
For the shadow economy, we rely on the OECD’s definition (2002) of “non-observed economy”, i.e. “production activities that are illegal, underground, informal, or otherwise missed by the statistical system”.
What is important to know about the dynamics of the shadow economy?
As there are very few estimates of the size of the shadow part in the agricultural sector – only for six countries for one year (Figure 1), we use an approximate indicator instead: the size of the shadow economy at the state level. This indicator has a strong correlation of almost 0.95 with available data on the shadow agricultural sector. Estimates of the size of the shadow economy are taken from Medina and Schneider (2018) that calculated using the MIMIC method.
Figure 1. Size of the shadow economy and the agricultural sector (share of GDP or the value added in the agricultural sector, %)
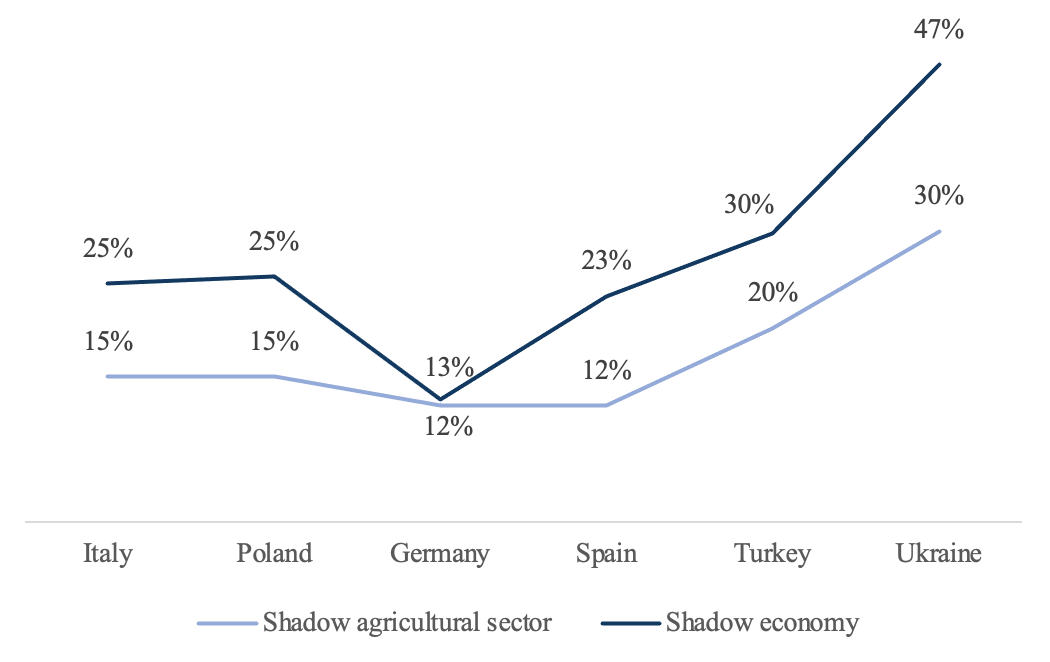
Source: own representation based on Schneider and Kearney (2013) and Medina and Schneider (2018) data
The size of the shadow economy varies much from country to country. However, over the last 25 years there has been a steady downward trend in the share of “shadow GDP” (Figure 2). The “spike” of the shadow market in 2009 is most likely due to the global financial crisis, when people and firms had strong motives to go into the shadows. However, later the positive dynamics resumed.
Figure 2. The average size of the shadow sector in 133 countries in 1995-2015, % of GDP
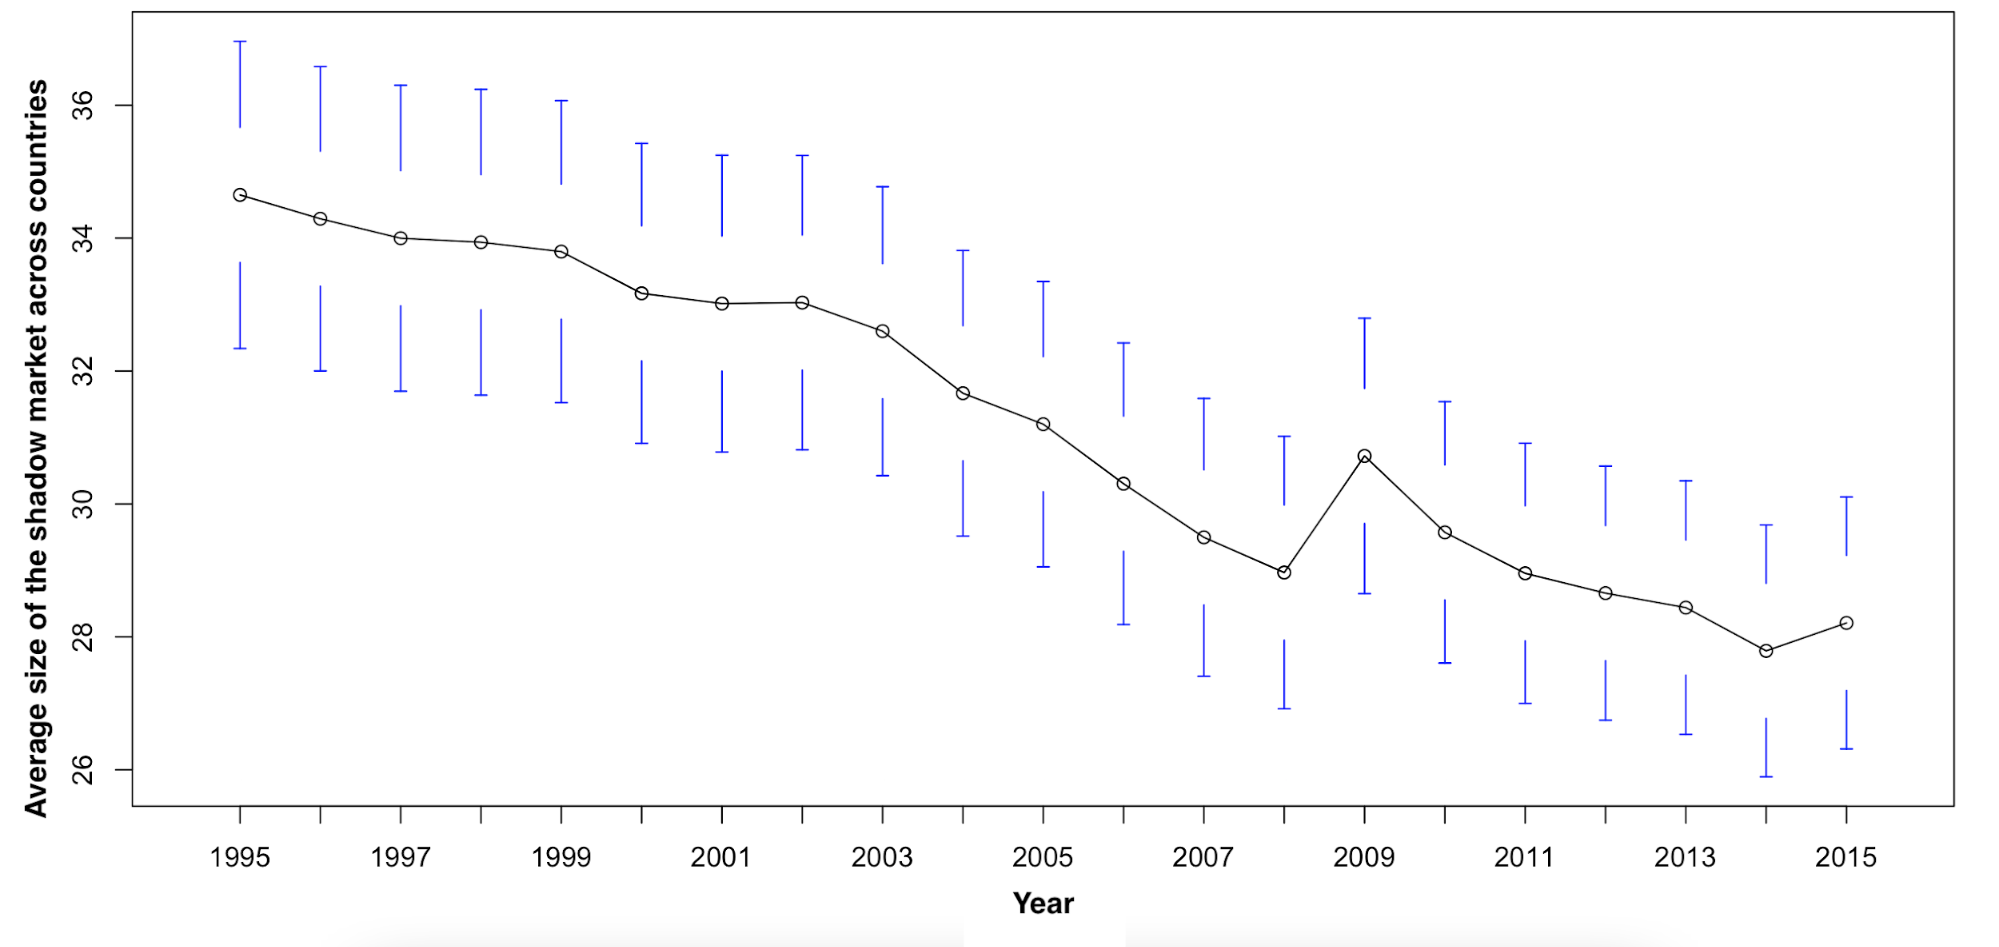
Source: own representation based on Medina and Schneider (2018) data
Countries across the world differ markedly in the size of their shadow economy (Figure 3).
Figure 3. The average size of the shadow economy in the world in 1995-2015 by country, % of GDP
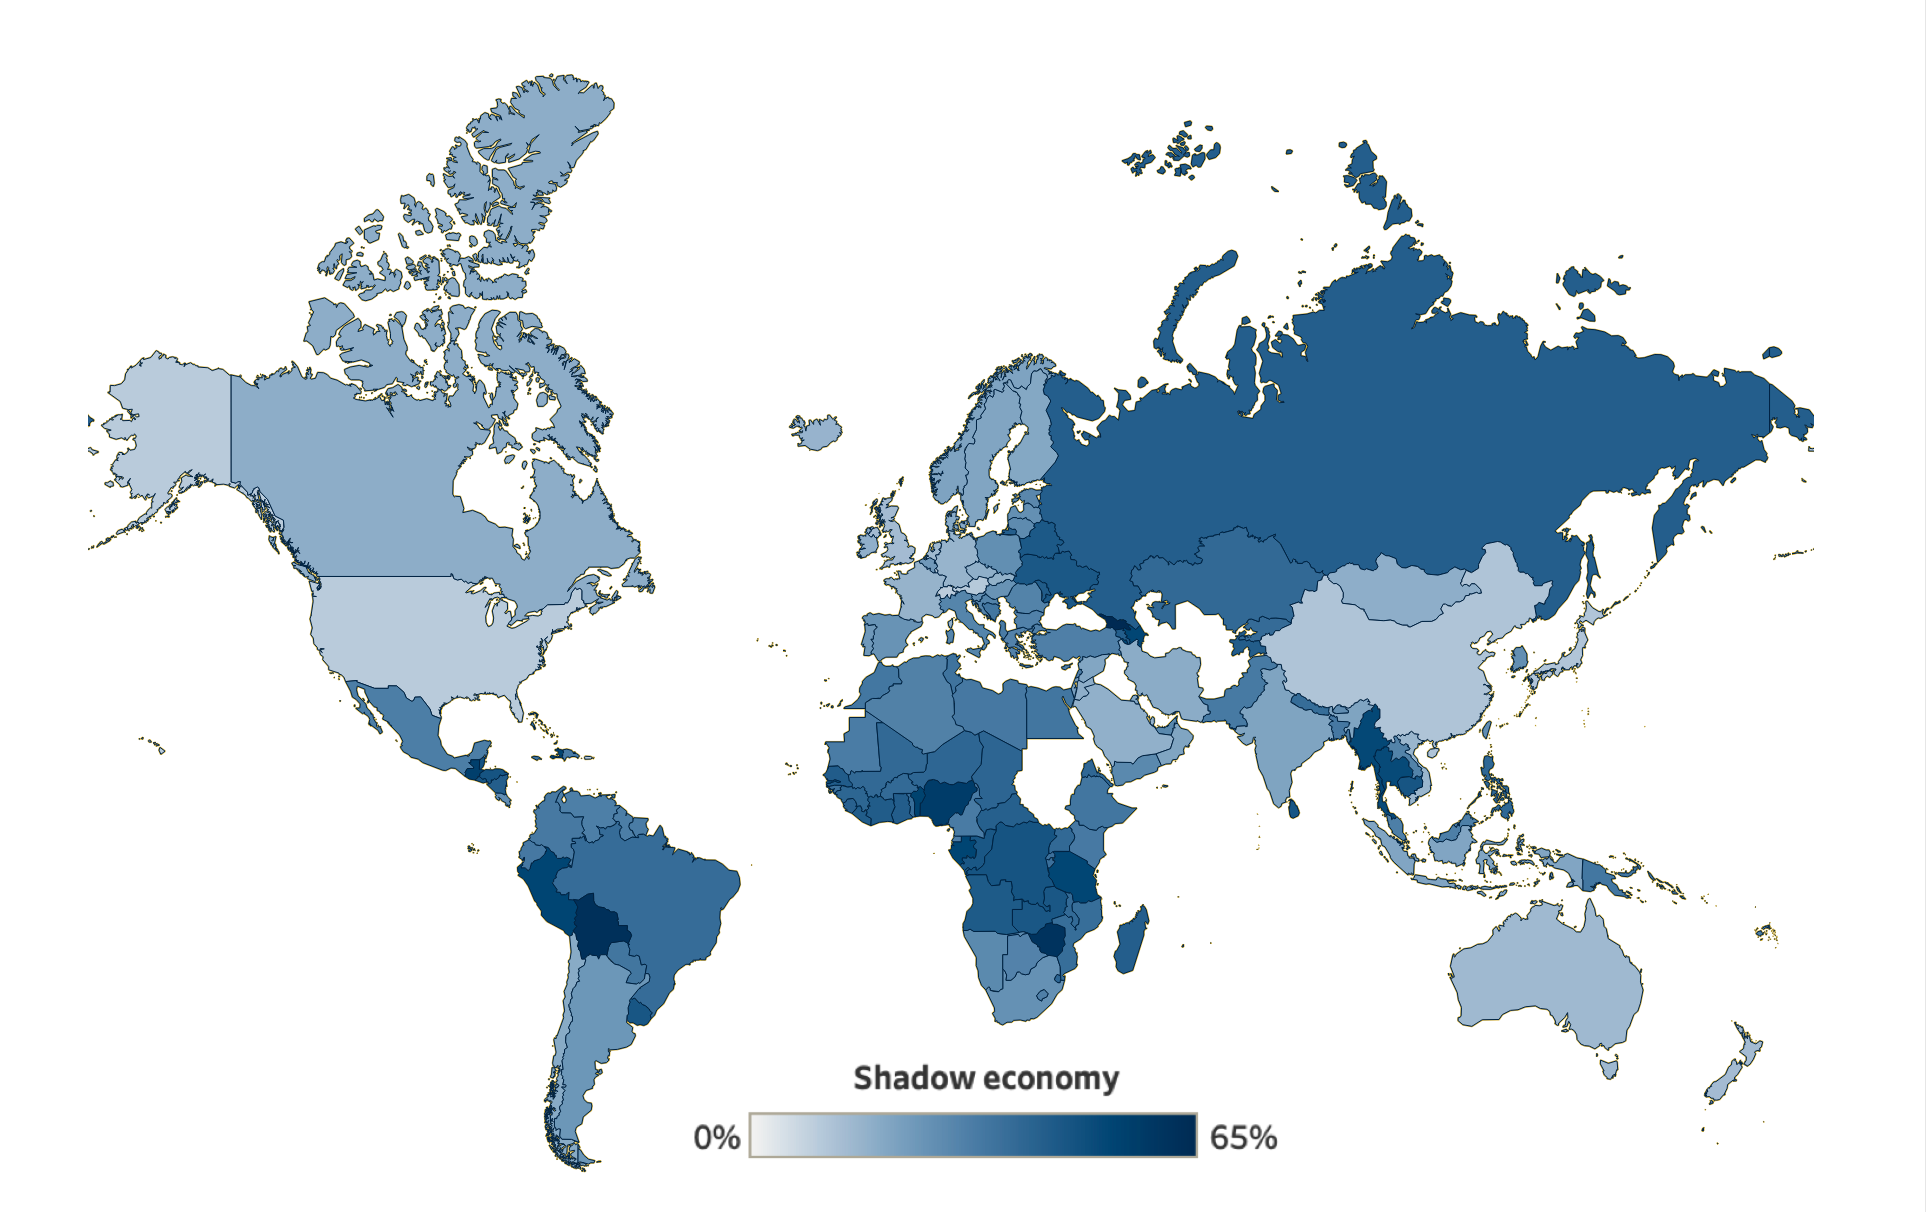
Source: own representation based on Medina and Schneider (2018) data
Australia has the smallest size of the shadow sector (an average of 14.1% of GDP in 1995-2015). For Australia and Oceania, this share is nearly 25%.
European countries (except Russia) have a similar size of the shadow sector, namely 24.7% of GDP. Among them, Switzerland is the “whitest” with the shadow sector of 8.9% of GDP. Asia has a higher “shadow” level than Europe. Among the countries having the biggest shadow sectors are Georgia (65%), Azerbaijan (52%), Myanmar and Thailand (51% each).
In the Western hemisphere, the shadow sector increases from North to South. The USA has the smallest size of the shadow economy (9.2%), with Guatemala having the biggest in North America (an average of 54.7%) and Bolivia (62.3%) in South America.
Africa is the most “shadow” continent. The average share of the shadow economy here is 39% of GDP.
Ukraine has a high level of the shadow sector in its economy: an average of 45% in 1995-2015. This estimate is close to the data found in Ukrainian research studies. For example, the Kyiv International Institute of Sociology (2019) estimated the size of the shadow economy in the regions of Ukraine using business survey data (Figure 4). According to these data, the shadow economy amounted to 46.8% and 47.2% of GDP in 2017 and 2018 respectively, with the difference of its share among the macro-regions amounting to 7 p.p. in 2017 and 3 p.p. in 2018.
Figure 4. The size of the shadow economy by region in 2017 and 2018
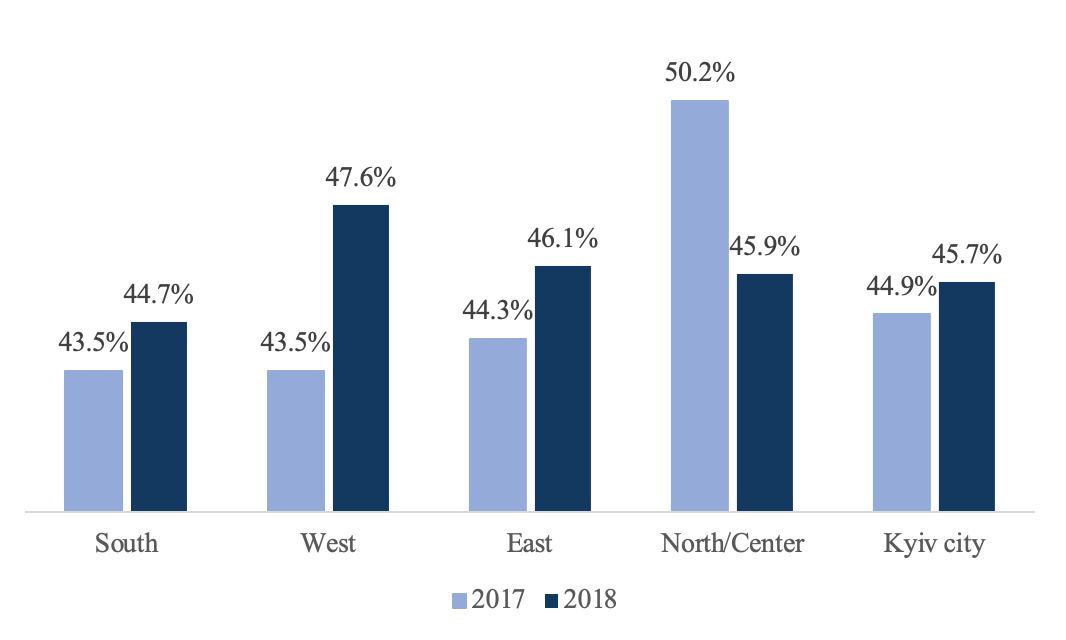
Source: own representation based on the data from the Kyiv International Institute of Sociology (2019)
Research methods and data
We took country data for 1995-2015 from several sources: USDA, estimates of the shadow economy by Medina and Schneider (2018), World Bank, FAO, OECD, Harvard Dataverse, Transparency International and Human Development Data.
We formulated the following research hypotheses:
- The size of “shadow” in the agricultural sector is negatively related to agricultural productivity.
- A larger size of the informal agricultural sector is associated with lower volume and/or poorer quality of public goods and services provided by the government to the agricultural sector.
We emphasize that we are considering correlation here and not a cause-effect relationship since the relationship between these factors clearly goes in both directions. Thus, if agricultural productivity is low, farmers tend to work “in the shadows” to evade taxes. However, if the size of the shadow sector is large, official data on yields, and hence, productivity, will be underreported. Besides, if the authorities provide a lot of high-quality public goods, the farmers will be willing to work “in the white” to get these goods. Therefore, the more “white” farmers, the more taxes and opportunities for the authorities to provide public services.
We estimate fixed effects regression on panel data to verify the first hypothesis and use the Heckman two-step selection model to check the second hypothesis. For both hypotheses, the share of the shadow sector in GDP is an independent variable.
Results
We got several interesting results. First, the shadow market is negatively related to agricultural productivity and expenditures on public goods per rural resident. That is, both hypotheses are confirmed.
Reducing the shadow market by 1 p.p. is, on average, associated with an increase in the productivity of the agricultural sector by 1.39 p.p. We also observed a nonlinear relationship: productivity decreases as the size of the shadow market increases to 67.7%, after which it starts to grow (it is, however, a hypothetical relationship because no country has a shadow economy of this size).
The growth of the shadow agricultural market by 1 p. p. is associated with a decrease in spending on public goods per rural resident, on average, by $4.36. That said, the average expenditures on public goods in the sample is $151.34, with a standard deviation of $189.06. On average, Ukraine provides public goods in the amount of $25.46 per rural resident.
Secondly, it turns out that public spending on the agricultural sector adversely affects productivity. This means that direct subsidies dominate in the agricultural support structure. OECD data confirms that it is actually the case (Figure 5), although indirect subsidies prevailed in Ukraine in some years.
Figure 5. The volume of direct and indirect subsidies to the agricultural sector in the world (26 countries) and Ukraine, million euros
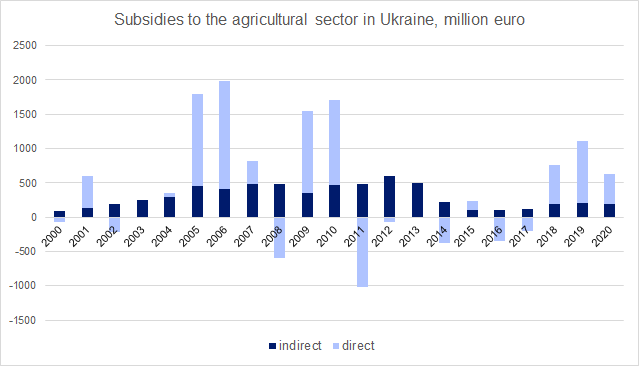
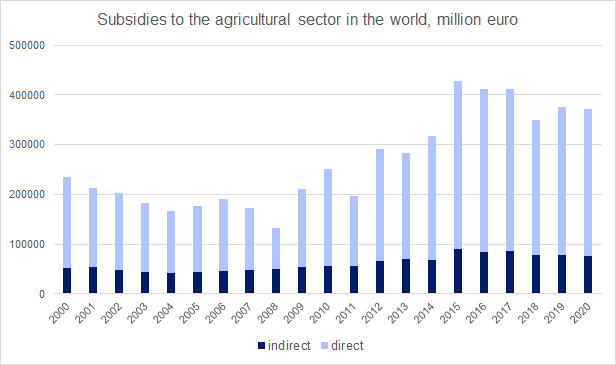
Source: OECD data
Why are direct subsidies counterproductive? They put farmers that do not receive subsidies at an unfair disadvantage, making distortions to investment and production structure. Therefore, there are resource outflows from farming enterprises preferred by the market to farming enterprises preferred by politicians, which leads to a reduced pace of growth and efficiency losses for the economy as a whole. While at the same time, indirect support (R&D, education, infrastructure, etc.), i.e. public goods, does not distort the market and brings the greatest benefit to the most efficient producers. Thus they increase productivity, the volume of production and the quality of agricultural products.
The same results for the economy as a whole, not just for the agricultural sector, were obtained by Elgin and Birinci (2016), whose methodology we used. The government should therefore reallocate public expenditures from private to public goods, which will contribute to sustainable economic growth and development.
Conclusion
In this article, we assessed the impact of the grey market on the development of agriculture and rural areas, measured as the productivity of agricultural production and spending on public goods in rural areas.
We showed that the growth of the shadow sector by 1 p.p. is associated with a decrease in productivity by 1.39 p.p. and a decrease in spending on public goods per villager by $4.36.
We also confirmed the result and theories of other studies saying that provision of public goods such as research, infrastructure, and education increases productivity, while direct support, i.e. subsidies to businesses, reduce productivity in the agricultural sector.
The government and local authorities thus have to focus on the provision of public goods. Not only will it increase the productivity of agriculture, but it can also facilitate its coming out of the shadows and help develop rural areas. Besides, reducing the share of the shadow sector will help facilitate the administration of taxes.
References
Elgin, Ceyhun, and Serdar Birinci. 2016. “Growth and informality: a comprehensive panel data analysis.” Journal of applied economics, Vol XIX, No. 2 (November 2016): 271-292.
Kubakh, Polina. “The effect of the shadow market on agriculture and rural development“. Master’s thesis. Kyiv School of Economics, 2021.
Kyiv International Institute of Sociology. 2019. “Press releases and reports. Shadow economies in Ukraine. Results of the 2019 survey.” European Commission. Accessed December 14. https://www.kiis.com.ua/?lang=eng&cat=reports&id=897
Medina, Leandro, and Friedrich Schneider. 2018. “Shadow Economies Around the World: What Did We Learn Over the Last 20 Years?” Working Paper No. 18/17. International Monetary Fund. January 24.
OECD. 2002. Measuring the Non-Observed Economy: A Handbook. Paris. https://www.oecd.org/sdd/na/1963116.pdf
Schneider, F., and Kearney, A. T. 2013. “The shadow economy in Europe”.
Attention
The author doesn`t work for, consult to, own shares in or receive funding from any company or organization that would benefit from this article, and have no relevant affiliations