The COVID-19 pandemic led to lockdowns in almost every country which in turn triggered a major economic crisis. One of the features of the crisis was the rise of cash demand in advanced and emerging market economies, despite the risk of getting infected with the virus and the recent developments of cashless payments. We look at the demand for cash in various regions of Ukraine and find that a possible driver of the demand for cash is informal employment.
During the lockdowns, a considerable surge in cash demand was observed in Ukraine as well as in other countries. The data provide several interesting insights. First, cash in circulation was growing during the entire year 2020, and at the end of 2020 it was 34% higher than in the beginning of the year. Similarly high growth of cash in circulation was observed during the previous crisis (2014-2015) when Ukraine experienced both high inflation and depreciation of the national currency as it went through the unstable political situation and the war with Russia (figure 1).
Figure 1. Cash growth rate over time. Share of non-cash payments (right axis).
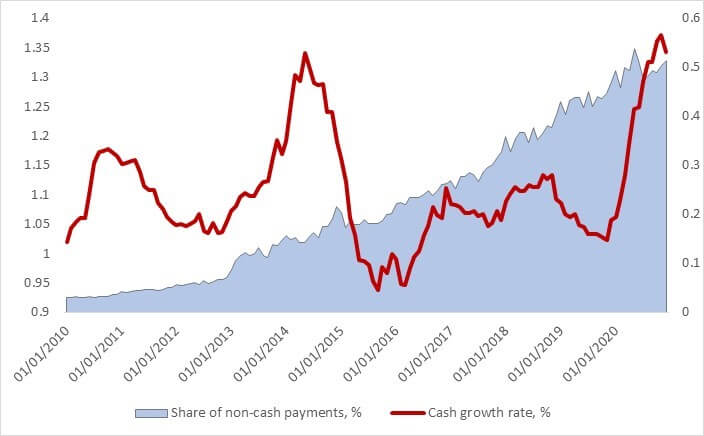
Source: National Bank of Ukraine
On the other hand, Ukraine faced the pandemic crisis more prepared: macroeconomic (low inflation and stable exchange rate) and financial (no banking crisis) stability provided a cushion to the economy. The hryvnia depreciated only in March 2020, but then it appreciated back. Also, the financial inclusion during the last years has developed substantially: the share of non-cash payments prior to the crisis reached 50%, which was the record high compared to just 20% during 2014-2015 (in this article financial inclusion is defined as the share of cashless transactions in all the observed transactions).
What can be the drivers for such an increase? What factors determine the demand for cash in Ukraine? In our study, we use regional dynamics to shed more light on these questions.
What does demand for cash show us?
According to the literature, shadow economic and criminal activity are positively related to cash usage (Herwartz et. al, 2015; Bartzsch et. al, 2019; Ardizzi et. al, 2013). What is the intuition behind it? When people do not want to be detected by the government, they are likely to use cash to conceal their activities because cash payments are hard to track, in contrast to banking transfers.
On the other hand, higher interest rates, as well as development of cashless infrastructure, induce people to reduce cash usage (Ardizzi et. al, 2013). If the interest rate is higher, it is better to put money in a bank deposit which earns interest rather than hold cash that earns nothing. Likewise, if there are more possibilities in a certain country or region for consumers to pay without cash (in shops, transport, etc.) as well as better financial technology is available (e.g NFC implemented in smartphones) the demand for cash will decrease.
What does the regional dynamics show us?
In this study, we use data from the National Bank of Ukraine. The data represents inflows and outflows of cash to banks’ cash desks. The banks submit information on cash turnovers to the regulator on a monthly basis. Banks’ reports are disaggregated by sources of inflows and outflows of cash (cash withdrawals by the banks’ clients, retailers’ revenue, the inflow of UAH cash due to selling FX, inflows on cards).
This data does not cover transactions on the informal markets (rynky), since sellers there are unlikely to be clients of banks. In this case, if a consumer withdraws cash from her card and then pays for some goods and services, only the first transaction will be counted.
For this analysis, we aggregated all items of inflows and outflows and calculated net cash demand by subtracting total inflows from total outflows. On the aggregate level net cash demand equals change in M0. If the variable takes negative values, it means that more cash enters the cash desks than flows out, thus demand for cash decreases and vice versa.
Regions show different dynamics of demand for cash during 2014-2020. Thus, in Kyiv, Odesa, Chernivtsi, and Zakarpattia the demand for cash consistently decreased (figure 2). While for the first two regions it can be explained by a higher financial inclusion, for the last two the reasons remain unclear (financial inclusion in these regions is much lower than in Kyiv and Odesa).
To the contrast, in Cherkasy, Chernihiv, Mykolaiv, Sumy, Vinnytsia, and Zhytomyr demand for cash over the last 6 years continuously increased (Figure 3). Other regions did not show a clear upward or downward trend during 2014-2020, and in 2020 demand for cash in all of them increased.
Why are such differences present across the Ukrainian regions? Can it be due to sectoral distribution of employment? We hypothesize that regions that have a larger share of workers employed in agriculture or retail will have higher cash usage.
The agricultural sector has strongly developed during the last few years. It is now one of the largest in Ukraine — it accounts for approximately 18% of total employment, according to Ukrstat data. However, small farmers are more likely to use cash rather than banking transfers. Moreover, the Ministry of Economy estimates that shadow activity in this sector is among the highest — it accounts for about 32% of total gross value added. This can be a driver of demand for cash.
Figure 2. Cash dynamics over time. Regions with negative cash demand. Recessions are shaded
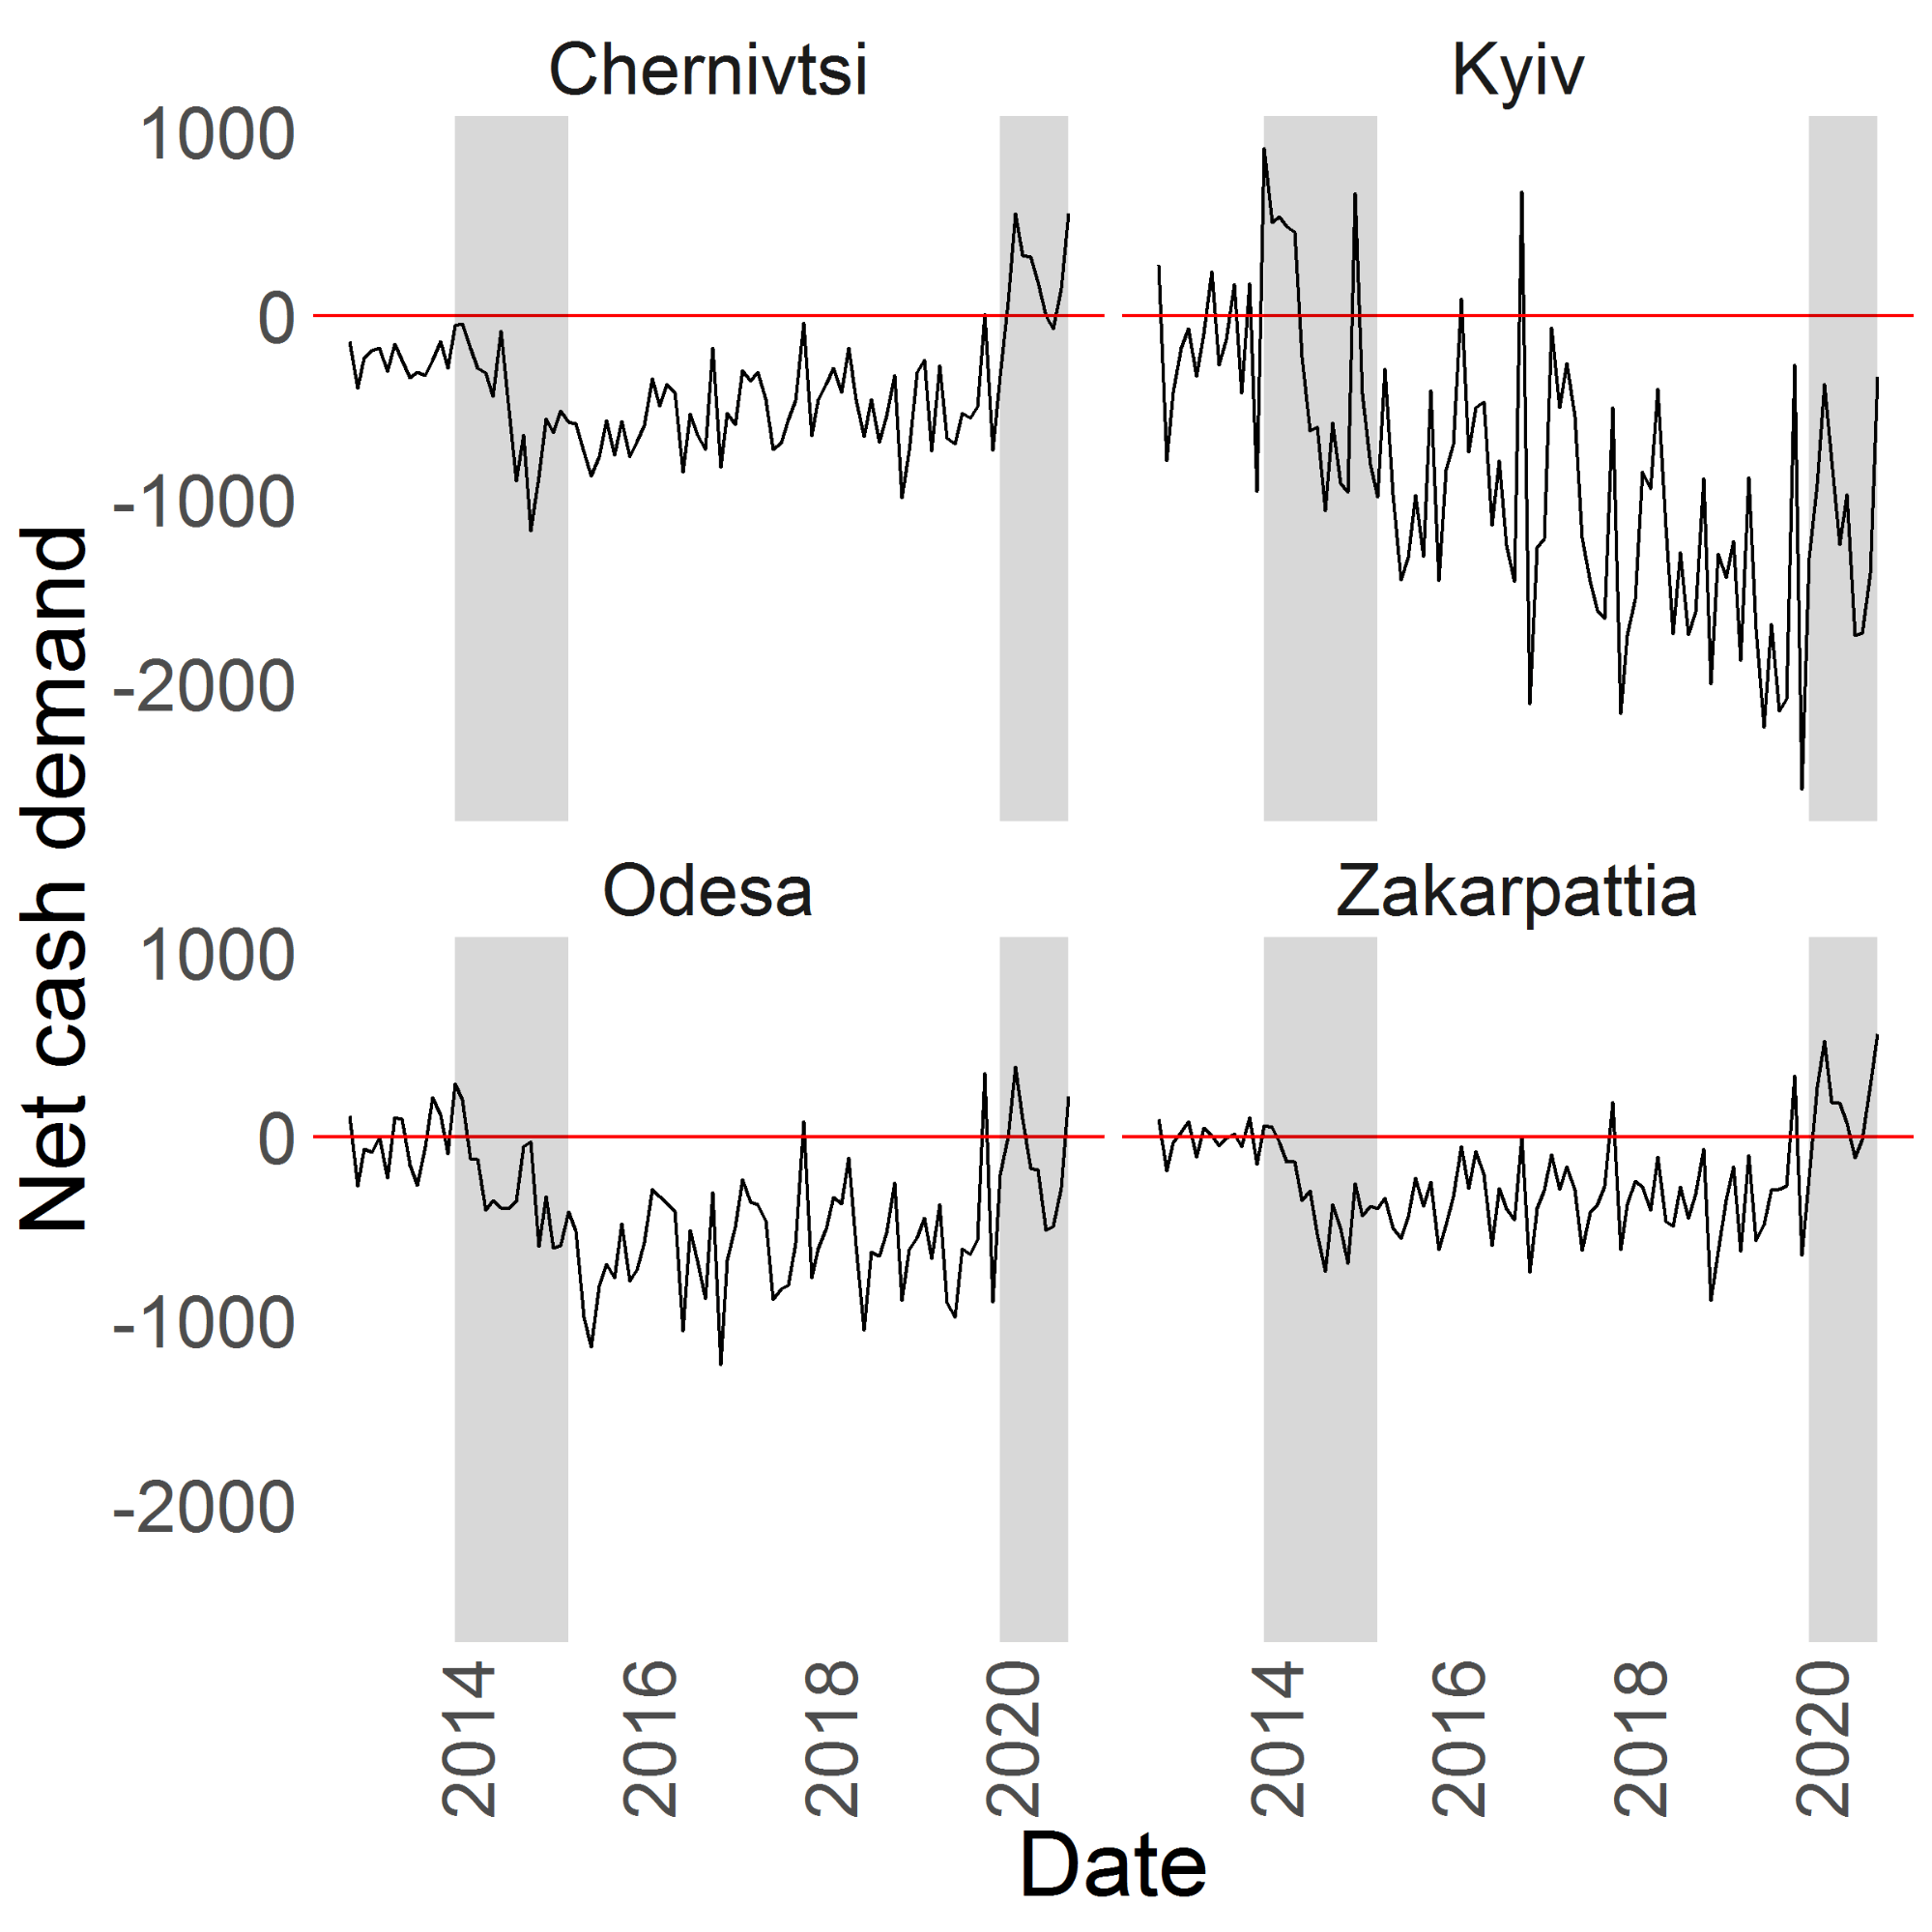
Source: National Bank of Ukraine
The situation in the retail sector is similar – even today not all shops and cafes have payment terminals.
Figure 3. Cash dynamics over time. Regions with positive cash demand. Recessions are shaded
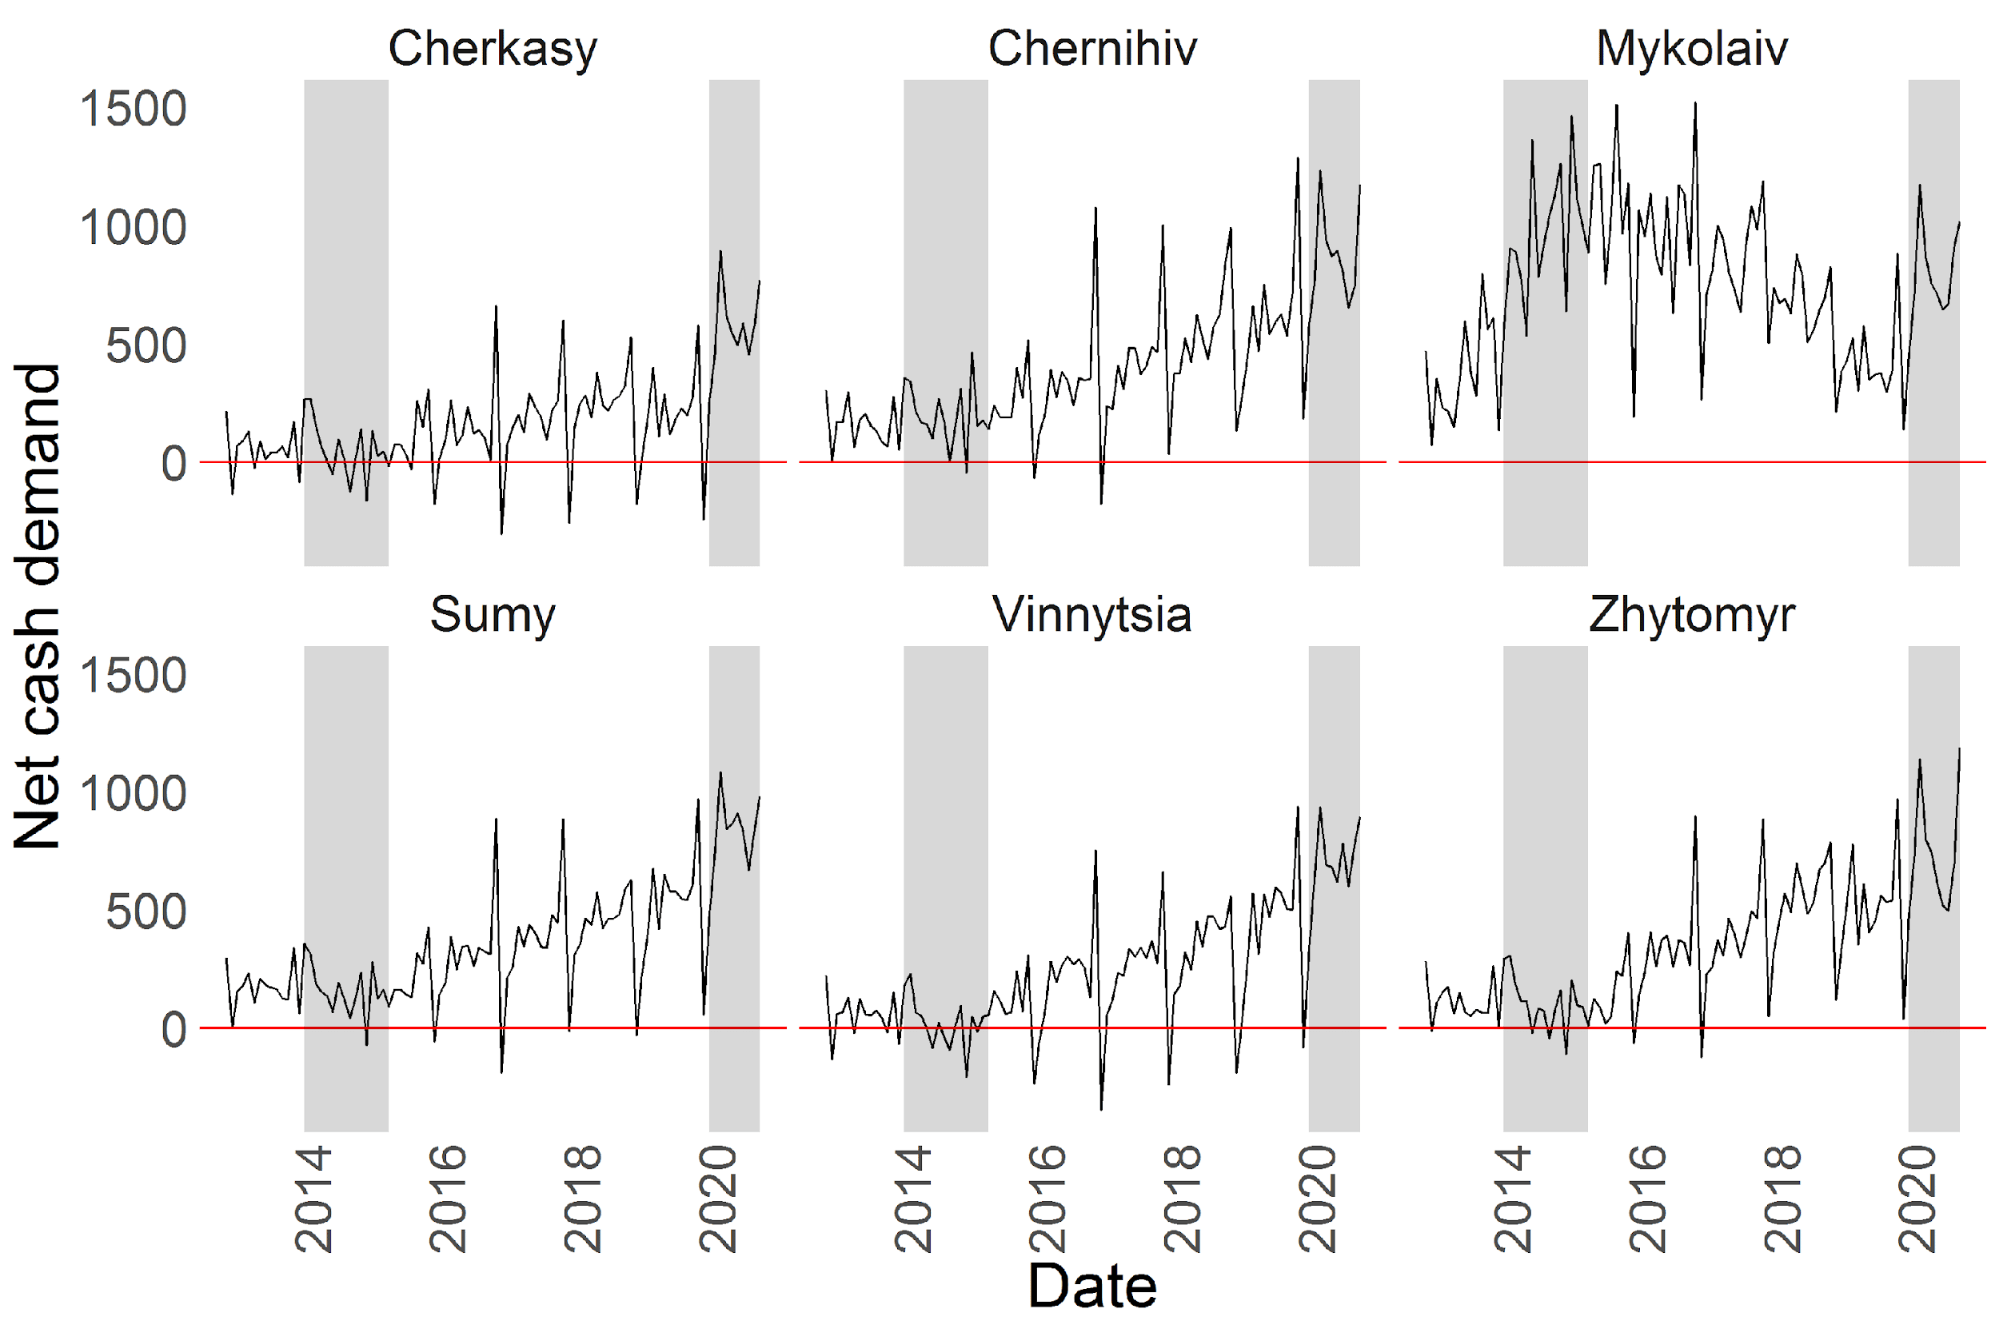
Source: National Bank of Ukraine
To assess the determinants of cash demand, we estimated the money demand function on a panel of Ukrainian regions for the period from 2013 to 2020. The dependent variable was net cash demand, while the set of explanatory variables included several factors from the literature (such as interest rate, number of terminals as well as drug-related crimes – these variables turn out to be not statistically significant). We included time and region fixed effects to control for possible unobserved variables. The list of controls also includes the shares of employment in agriculture, retail, construction and manufacturing. These sectors were selected because they are the largest in Ukraine and together account for about 60% of employment.
Results
The results of the econometric model show several interesting insights.
First, in line with our expectations and literature interest rate is negatively related to the demand for cash.
Second, the share of employment in the construction sector is positively related to cash usage, i.e. regions with higher than average employment in the construction sector have higher demand for cash. This is similar to the results of Ardizzi et. al (2018) for Italy. It may signal that the share of shadow economic activities and thus demand for cash is higher in this sector than in others.
Contrary to our hypothesis, larger employment in agriculture and retail does not significantly impact the demand for cash. Probably, in these sectors use of cashless transactions by large companies offsets cash demand by smaller players.
Conclusions
The results of this study can be useful to both banks and the government. Banks can improve their liquidity management by allocating more cash into regions with higher employment in construction. Construction sector in Ukraine has grown at a double-digit rate over the last few years, and we found it to be a driver of the demand for cash. Thus, the government may consider developing a policy for promotion of formal employment in this sector – for example, introduction of flexible employment contracts, since the seasonality in this sector is high. The demand for cash could be a measure of effectiveness of this policy. If it is successful, it can be extended to other sectors.
References
- Ardizzi, Guerino, Carmelo Petraglia, Massimiliano Piacenza, and Gilberto Turati. 2013. “Measuring the Underground Economy with the Currency Demand Approach: A Reinterpretation of the Methodology, with an Application to Italy.” The Review of Income and Wealth. https://doi.org/10.1111/roiw.12019.
- Ardizzi, Guerino, Pierpaolo De Franceschis, and Michele Giammatteo. 2018. “Cash Payment Anomalies and Money Laundering: An Econometric Analysis of Italian Municipalities.” International Review of Law and Economics 56 (C): 105–21.
- Bartzsch, Nikolaus, Friedrich Schneider, and Mathhias Uhl. 2019. “Cash Use in Germany.” n.d. Bundesbank.De. Accessed February 23, 2021. https://www.bundesbank.de/en/publications/reports/studies/cash-use-in-germany-814448.
- Herwartz, Helmut, Jordi Sardà, and Bernd Theilen. 2016. “Money Demand and the Shadow Economy: Empirical Evidence from OECD Countries.” Empirical Economics 50 (4): 1627–45.

Attention
The author doesn`t work for, consult to, own shares in or receive funding from any company or organization that would benefit from this article, and have no relevant affiliations