Pandemic and containment measures have had a serious negative impact not only on population health but also on its well-being. Countries all over the world experienced a slump in GDP, a surge in unemployment and poverty levels. Many governments tried to support firms and people using various fiscal and monetary policy instruments. We look at policy responses of 20 countries and see that Ukraine used most of the policies employed by developed and developing states. However, Ukraine could have used them faster and at a larger scale – if it had secured the IMF program earlier.
When China locked down the province of Wuhan, hardly anyone could imagine the scale of disruption COVID-19 would bring to the world. At that time many people thought that China would lose a few percent of GDP in the first quarter of 2020 and would soon recover afterwards, without much negative spillovers. However, in a few weeks the situation changed dramatically. Entire nations were sent into lockdowns with devastating economic consequences. Soon it became clear that the current crisis was much worse than the Great Recession of 2008-2009. Thus, the role of governments in organizing healthcare response to COVID and supporting their economies has grown. They applied a wide spectrum of monetary and fiscal policy instruments to stimulate the economies at the macro level and to support firms and households. International organizations also reacted swiftly offering loans and grants to countries that did not have enough internal resources – since the government response to a crisis should be fast and large.
Ukraine’s GDP fell by 11% yoy in the second quarter of 2020, which is bad but better than in many EU countries and close to the OECD average. The factors behind this relative success are high share of agrarian sector in the economy and reforms favourable for macroeconomic stability implemented during the last five years. Policy response of Ukraine’s authorities probably had some positive effect too. While it is difficult to quantify the impact of adopted policy measures at the moment, it would be helpful to put them into international context. Looking at instruments which other countries employed we can tell whether there are some additional measures that Ukraine could use. The answer to this question is no. But Ukraine can scale up the instruments it already uses – if it has resources for that. To gain access to resources, the government must secure cooperation with its international partners – first of all the IMF.
The main findings
- Ukraine used 6 of 8 monetary policy measures while countries considered in this text used from 1 to 6 measures with an average of 3.75 measures. Ukraine did not use quantitative easing (QE) and FX swaps. During the current crisis some emerging markets for the first time used QE. Whether this was the right decision, remains to be seen – some countries already had to deal with its negative consequences (weakening currency). We strongly believe that risks of this policy for Ukraine outweigh its possible benefits.
- Ukraine used 6 of 7 fiscal policy measures most frequently used by other countries. Countries in our sample used from 2 to 7 measures with an average of 4.6 measures. Ukraine did not use direct support of firms. This policy bears a huge corruption risk and thus should be carefully designed to have as much transparency and as little discretion as possible. Taking into account Ukraine’s weak institutions, we do not recommend using this policy.
- However, the magnitude of fiscal response was small. As of July 2020 (when the data was collected), Ukraine allocated 2.3% of GDP on fiscal stimulus – this is the second lowest number in our sample. Moldova and Bulgaria allocated comparable amounts – 2.4% and 2.5% of GDP respectively. Obviously, richer countries can spend more – for example, Greece allocated 14% of its GDP to support the economy, and Canada 15%. And if we take into account loan guarantees, the leaders are Italy and Germany with 30% and 33% of GDP respectively.
Having limited resources, poorer countries should aim at a higher efficiency of spending. For example, elsewhere we argued that paying UAH 1000 to pensioners was not the most efficient use of funds, and that the government should pay more attention to households that lost all their sources of income. Along with supporting vulnerable households, public investment into infrastructure, including education and healthcare, has higher multipliers than additional transfers to pensioners because it not only boosts demand in the short run but also raises productivity in the long run.
One of the most prominent features of the current COVID-19 crisis is that it has both supply and demand shocks. From the policy perspective this means that authorities and regulators may apply a wide range of monetary and fiscal instruments to support the economy. We compare Ukraine to a sample of countries which are selected along three dimensions based on geographical and economic proximity to Ukraine. How does Ukraine benchmark against the peers?
Core policy responses are provided in two tables below. Table 1 summarizes monetary policy and table 2 provides fiscal measures. We put these measures into the context of how each specific country was hurt by the pandemic (for a detailed methodology see Box at the end of the article).
Monetary policy: conventional tools
One may note from Table 1 that developing countries mostly used conventional monetary policy tools while developed ones used those up during the previous crisis and thus almost immediately switched to unconventional instruments.
Emerging markets cut their policy rates while the European Central Bank that already had its rate at near zero did not. Developing countries lowered mandatory reserve requirements while many developed ones already do not require their banks to hold reserves (of emerging markets only Mexico allows zero reserves). Emerging markets narrowed their interest rate corridor (the corridor between lending and deposit standing facilities) to help money market rates stabilize around the policy rate and make them less volatile. Developed countries did not have to do that because there market rates closely follow the key rates declared by the central bank. Central banks of developing countries increased the frequency of regular operations to give banks more liquidity management flexibility. This is not crucial in countries with developed interbank markets if there is no widespread crisis of trust between banks.
The only notable exception was Kazakhstan: it initially hiked its key rate to curb the national currency depreciation caused by a drop in the oil price. In a few weeks after that, the National Bank of Kazakhstan (NBK) reduced the key rate to the pre-hike level. After three more months, NBK adjusted the rate to be only marginally below the pre-crisis level. Kazakhstan also initially widened its interest rate corridor and narrowed it back only at the end of July.
Some policy instruments are used by both developed and emerging market countries. One of them is widening the list of eligible types of collateral. This not only raises the volume of potential refinancing from the regulator but also incentivizes the money market.
Another extensively used instrument is the launch or intensification of operations at longer-term maturities. It is not just about several months tenors which are already very long in terms of conventional monetary policy (e.g. Czechia introduced operations with a three-month maturity), but mainly about the operations with the tenors of several years. The examples are ECB, NBU (Ukraine), Bank of Israel, MNB (Hungary), Banxico (Mexico), Reserve Bank of Australia. The goal is to increase the supply of bank credit to businesses, especially SMEs. For example, MNB provides refinancing loans with up to five-year maturity periods at a fixed rate with unlimited amount. The special facility supplies credit institutions with funds at zero interest rate to be lent to SMEs at an interest rate of maximum 2.5%. In Australia, funding is provided for three years at a fixed interest rate of 0.25%. In general, many central banks switched from auction-based liquidity provision to operations at the fixed rate and unlimited amount. The NBU provides refinancing loans for up to five years at the NBU key rate.
Table 1. Ukraine and selected countries’ monetary policy responses to the pandemic-caused crisis
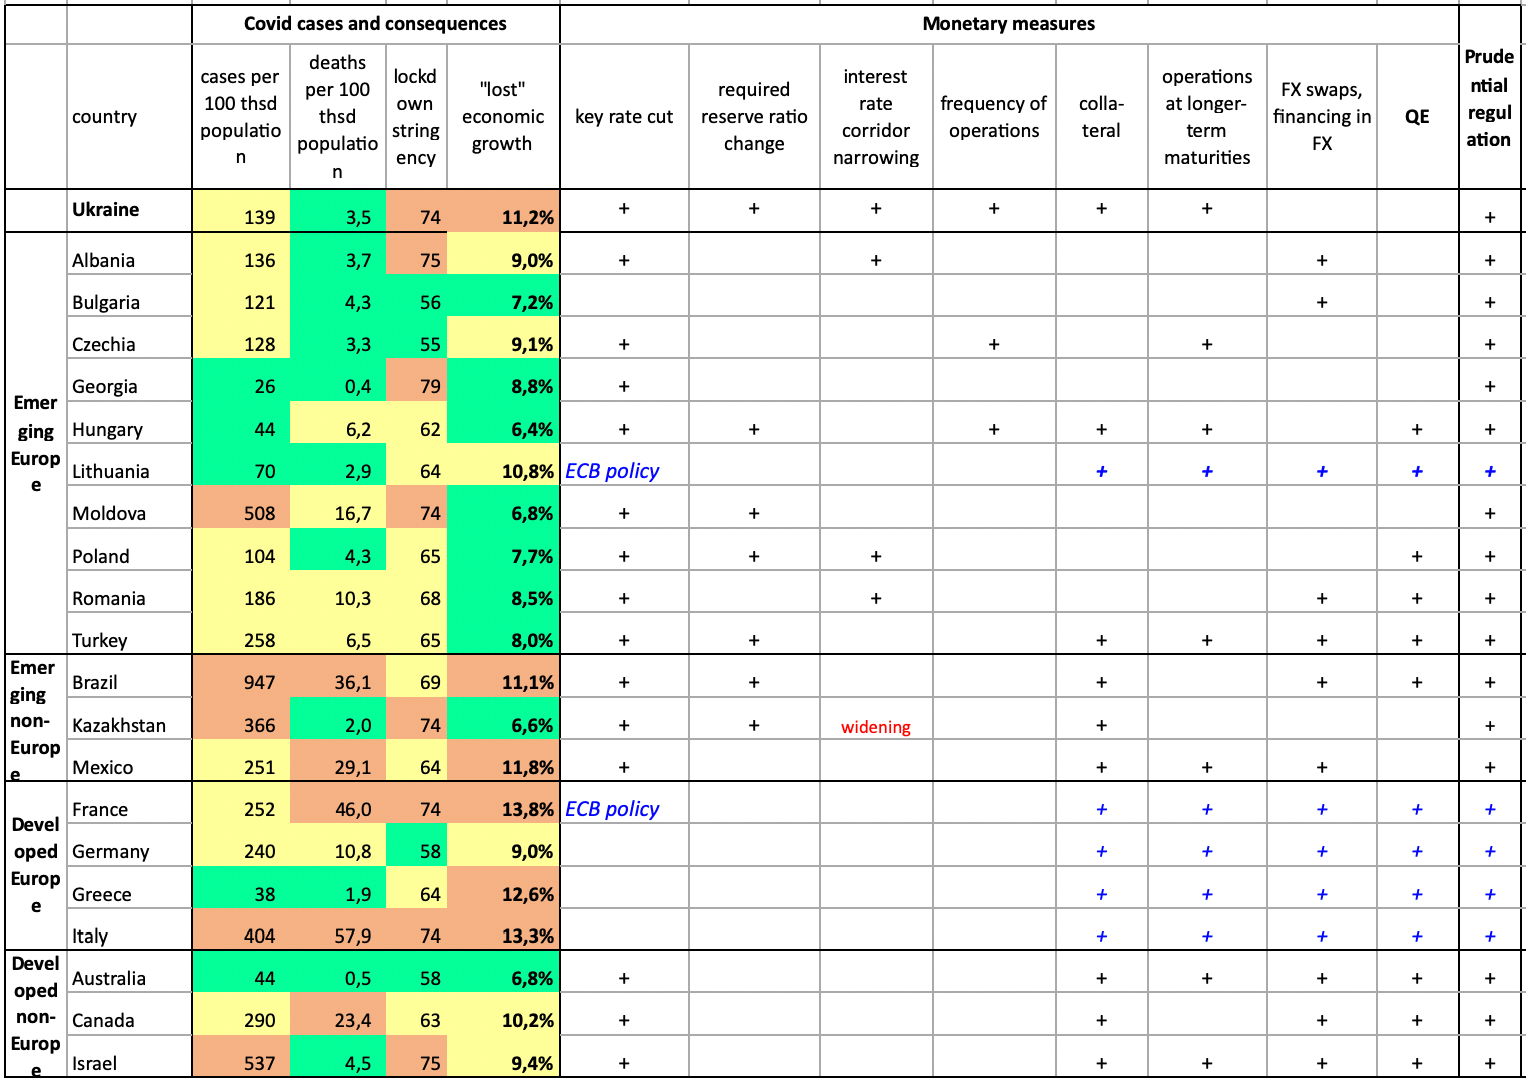
Sources: WHO, www.worldometers.info, The Oxford COVID-19 Government Response Tracker (OxCGRT), IMF World Economic Outlook, IMF Policy Responses to COVID-19 Tracker, central banks’ websites.
Thresholds for COVID-19 cases per 100 thousand people: “green” zone – below 100, “yellow” zone – from 100 to 300, “red” zone – above 300. Thresholds for COVID-19-caused deaths per 100 thousand people: “green” zone – below 5, “yellow” zone – from 5 to 20, “red” zone – above 20. Lockdown stringency is measured as simple average of OxCGRT index in March-June. Thresholds: “green” zone – below 60, “yellow” zone – from 60 to 70, “red” zone – above 70. “Lost” economic growth is the difference between IMF WEO October 2019 projection for 2020 growth and IMF WEO June 2020* projection for 2020 growth (*as of June 2020 for Poland, Turkey, Brazil, Kazakhstan, Mexico, France, Germany, Italy, Australia, Canada; as of April 2020 for other countries). Thresholds: “green” zone – below 9%, “yellow” zone – from 9% to 11%, “red” zone – above 11%.
All the data as of end of July 2020.
An important instrument of anti-crisis monetary policy is foreign currency liquidity provision. It is crucial in times of turbulence, especially for emerging markets, in order to diminish the pressure on local currencies. As we observe from Table 1, the majority of banks used FX swaps to provide liquidity in hard currencies to local banks. ECB offered 7-day US dollar operations on a daily basis. Some banks from emerging Europe (e.g. Albania, Bulgaria, Romania) set up swap lines with the ECB to provide euro liquidity to domestic banks. Non-European central banks set up swap lines with the Fed to get temporary USD funding: Australia, Brazil, Canada, and Mexico. Bank of Israel also provides USD liquidity through FX swaps to domestic banks. Turkey released additional FX liquidity by decreasing required reserves ratio for FX liabilities by 500 bps (and increasing it in four months by 300 bps “as a part of the normalization process”).
Monetary policy: unconventional tools
During the current crisis many countries decided to resort to the unconventional policy – quantitative easing (QE). During QE a central bank purchases government bonds or other financial assets in order to inject money into the economy, or support the secondary market thereby facilitating government borrowings. For instance, besides buying government securities, central banks of Brazil, Canada and Israel buy corporate bonds, and the Hungarian central bank buys mortgage bonds.
QE was employed by all developed countries and some emerging ones (Poland, Romania, Hungary, Turkey, and Brazil). While for developed countries with stable currencies and lower inflation the risks of this policy are acceptable, the case of emerging markets is debatable.
QE is expected to allow fiscal authorities to introduce large anti-crisis budget stimulus without the risk of collapsing the sovereign debt market. The example of Hungary presented in Figure 1 shows the tension in the government bonds market which MNB handled with its policy announcements and subsequent purchases of securities. Thus, by conducting QE central banks provide a significant amount of liquidity to banks and backstop the rates at which ministries of finance attract funds to finance their deficits.
Figure 1. Hungarian sovereign debt market rates
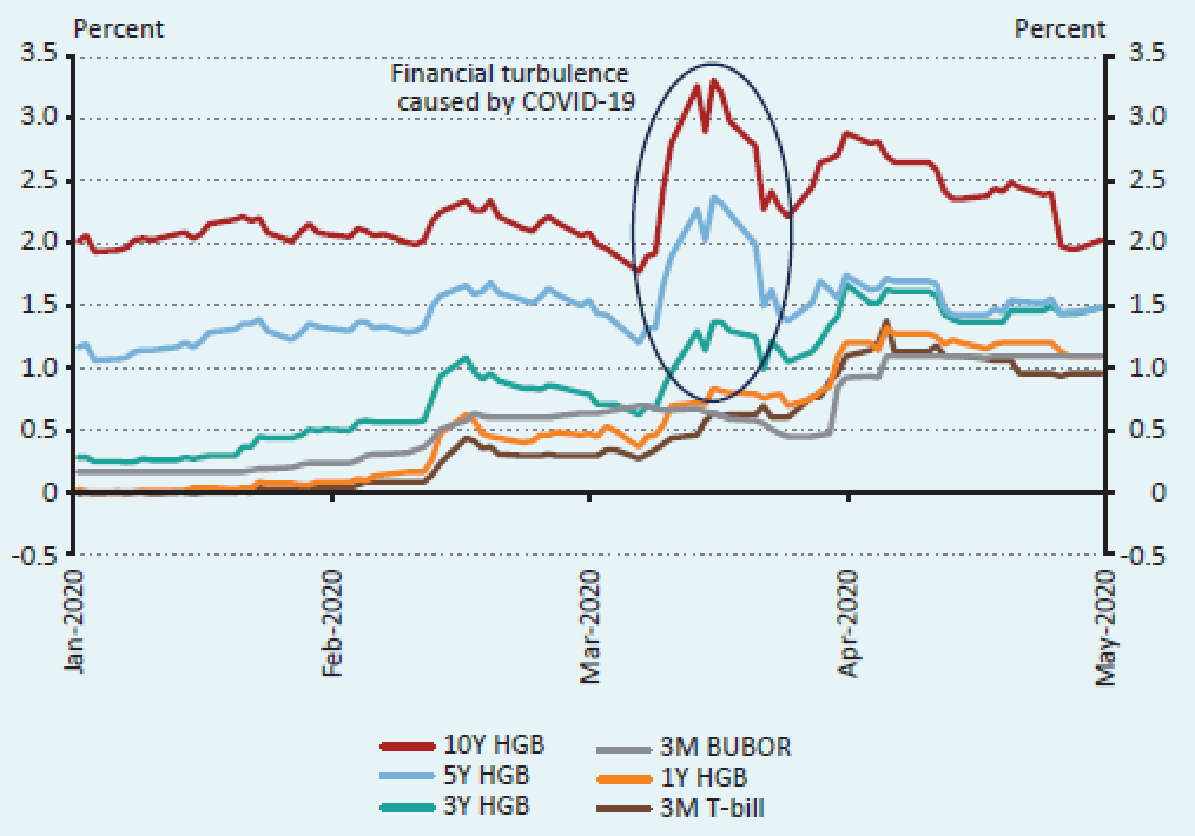
Source: MNB.
Some analysts suggest that in the environment of very low interest rates and significant financing obligations, it can become a permanent part of the policy toolkit in emerging European countries.
However, the use of this policy bears large macroeconomic risks in countries with a history of large national currency depreciations and unstable inflation. When introduced at the “request” of the government, it also undermines central bank credibility. Lack of credibility, in its turn, undermines other instruments used by the central banks such as changing the policy rate. Besides, QE puts pressure on exchange rates of national currencies. Thus, the Romanian central bank had to intervene in the FX market, and the central bank of Hungary resumed liquidity absorbing operations. Weakening local currency leads to higher inflation expectations and inflation risks. Under these conditions, increasing money supply means adding gasoline to the fire.
Fiscal policy: tax cuts, subsidies and transfers, and loan guarantees
National governments proposed a great variety of measures to address the pandemic-caused economic downturn (table 2). We categorize them into direct and indirect, aimed at households and business and also provide calculation of fiscal stimulus for Ukraine (table 3).
Nearly all countries in our sample supported households with cash payments, although the sums varied substantially. They usually targeted vulnerable households, e.g. those with retirees, disabled, children, students, jobseekers, etc. Czechia made payments to self-employed and independent contractors, i.e. individuals who usually lack job protection. Some countries, including Ukraine, introduced indirect support to households, e.g. utility subsidies, bank loans service holidays or subsidized mortgage programs for individuals, and softened access to social support programs, e.g. unemployment benefits. Georgia cut income tax for low-income citizens.
Table 2. Ukraine and selected countries’ fiscal policy responses to the pandemic-caused crisis
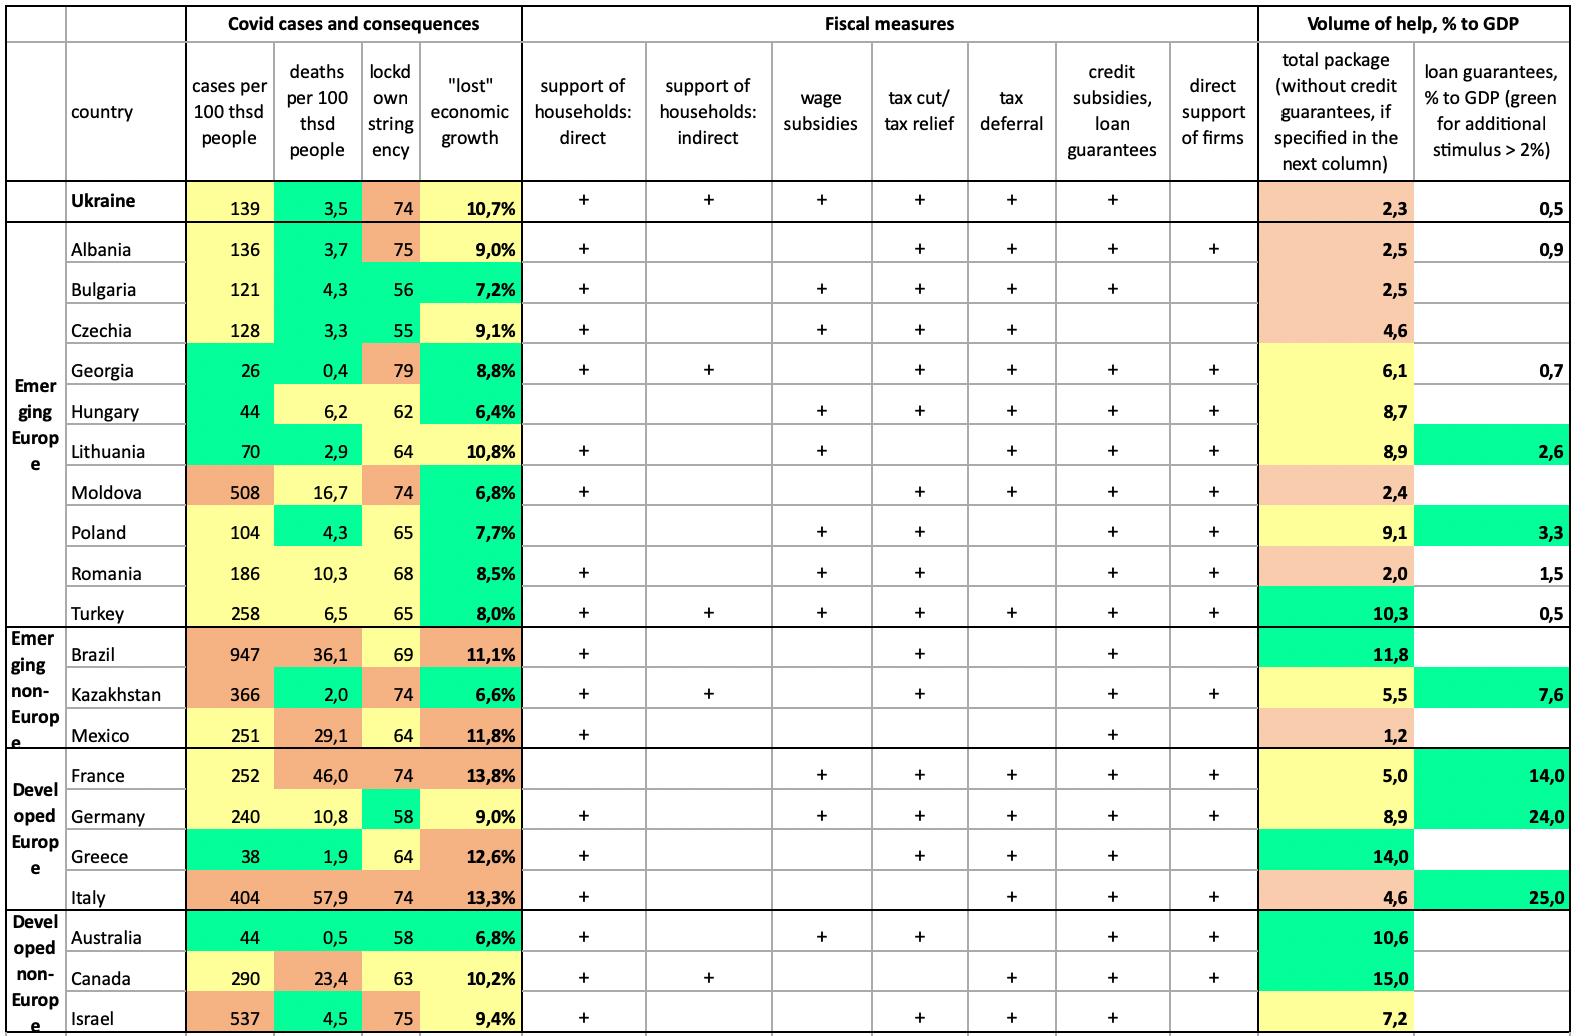
Sources: WHO, www.worldometers.info, The Oxford COVID-19 Government Response Tracker (OxCGRT), IMF World Economic Outlook, IMF Policy Responses to COVID-19 Tracker, websites of national state authorities. Thresholds for the volume of help as % of GDP: “green” zone – above 10%, “yellow” zone – from 5% to 10%, “red” zone – below 5%. All other notes are the same as for Tab. 1. All the data as of end of July 2020.
The most common measures to support business were tax reliefs/ deferrals and credit relief, i.e. firms that [partly] lost revenues were freed of some part of mandatory expenses. The exact design of these measures varied greatly. For example, Germany, Czechia, Greece slashed VAT on selected goods and services, Albania reduced the profit tax for small businesses, Israel lowered property tax, France reduced taxes for the tourist industry. Hungary, Poland, Czechia, and Ukraine partly lifted or subsidized employers’ social contributions.
Credit relief measures included credit holidays (EU, Ukraine), loan guarantees (many EU countries), subsidized loans or investment grants (Poland, Mexico, Hungary), subsidies on interest payments (Romania), interest rate caps (Albania, Hungary).
Many governments support firms in the most affected sectors with direct subsidies. The Turkish Wealth Fund buys stakes in distressed firms but this is an unusual policy, which may cause problems in the future. For example, these partly nationalized companies may plea for the government support even as the situation in the economy improves or they may be used for rent-seeking.
Some measures, e.g. wage subsidies, support both households and firms. For example, the Bulgarian government covers 60% of wages of employees in affected industries that would have been laid off otherwise.
Another type of fiscal stimulus is public investment. This instrument was ‘invented’ during the Great Depression. It has one of the highest multipliers and is used by many countries. For example, the EU countries will finance many earmarked programs for SMEs, labor markets, green energy, climate change projects, and digitalization. Australia invests budget funds into fast-track infrastructure projects, and Kazakhstan is initiating large-scale projects to modernize its transport infrastructure.
In a similar spirit, Ukraine allocated over a half of its COVID Fund for road construction.
Table 3 provides cash estimates of fiscal measures implemented by the Ukrainian government to support households and firms. The COVID Fund accumulates UAH 66 billion, and the approximate amount of other fiscal stimulus is UAH 24.1 billion, totalling to UAH 90.1 billion or 2.26% of GDP. Of these UAH 35 billion (0.88% of GDP) are allocated to construction projects.
Table 3. Support measures for households and businesses in Ukraine
| Households | Estimated amount | Business | Estimated amount | |
| Direct support | Cash allowances to pensioners | UAH 10.6B | Wage subsidies | Fund |
| Payments to individual entrepreneurs with children under 10 | Fund | Tax allowances:
– social security contributions for individual entrepreneurs |
UAH 8.8B2 | |
| Wage subsidies | Fund | – property tax | UAH 4.7B3 | |
| Indirect support | Subsidies and cancelling fines on late utility
payments |
* | Loan guarantees (expected) | UAH 20.8B4 |
| Loan ‘vacations’ | Not a part of budget expenditures | Loan ‘vacations’ | Not part of budget expenditures | |
| Total estimated volume of fiscal support is 66.0B+10.6B+8.8B+4.7B= UAH 90.1B, or 2.3% of GDP (GDP for 2019), and the potential loan guarantees is UAH 20.8B, or 0.5% of GDP | ||||
2 – pfu.gov.ua/2122510-nadhodzhennya-do-byudzhetu-pensijnogo-fondu-ukrayiny-chastyny-yedynogo-sotsialnogo-vnesku-3/ (we estimated using the value of Pension Fund losses: 2.5B*3 months and divided by 0.856215, which is the share of contributions going to the Pension Fund)
3 – voxukraine.org/uk/chi-vizhivut-byudzheti-otg-u-borotbi-z-koronovirusom/ (we estimated using data from Table 1 as (11.2768+17.1465)*(2/12))
4 – Calculated as 40.0B of total promised volume minus 19.2B of guarantees already provided this year to Ukravtodor (unrelated to the anti-COVID19 program);
*No estimate, but the amount is expected to be small compared to other measures
Estimated volumes of national fiscal packages vary widely. The lowest figure is 1.2% of GDP for Mexico. The highest figures reach two-digit numbers in terms of GDP shares: e.g. approximately 14% and 15% in Greece and Canada respectively, and even higher if we take into account potential credit guarantees (24% and 25% of GDP in Germany and Italy respectively). At the end of July, European commission announced a huge recovery plan – EUR 750 billion for the entire Union. Ukraine compared to our sample countries has not spent much – about 2.3% of GDP (as of end-July).
Figure 2. Fiscal stimuli of selected countries, % of GDP
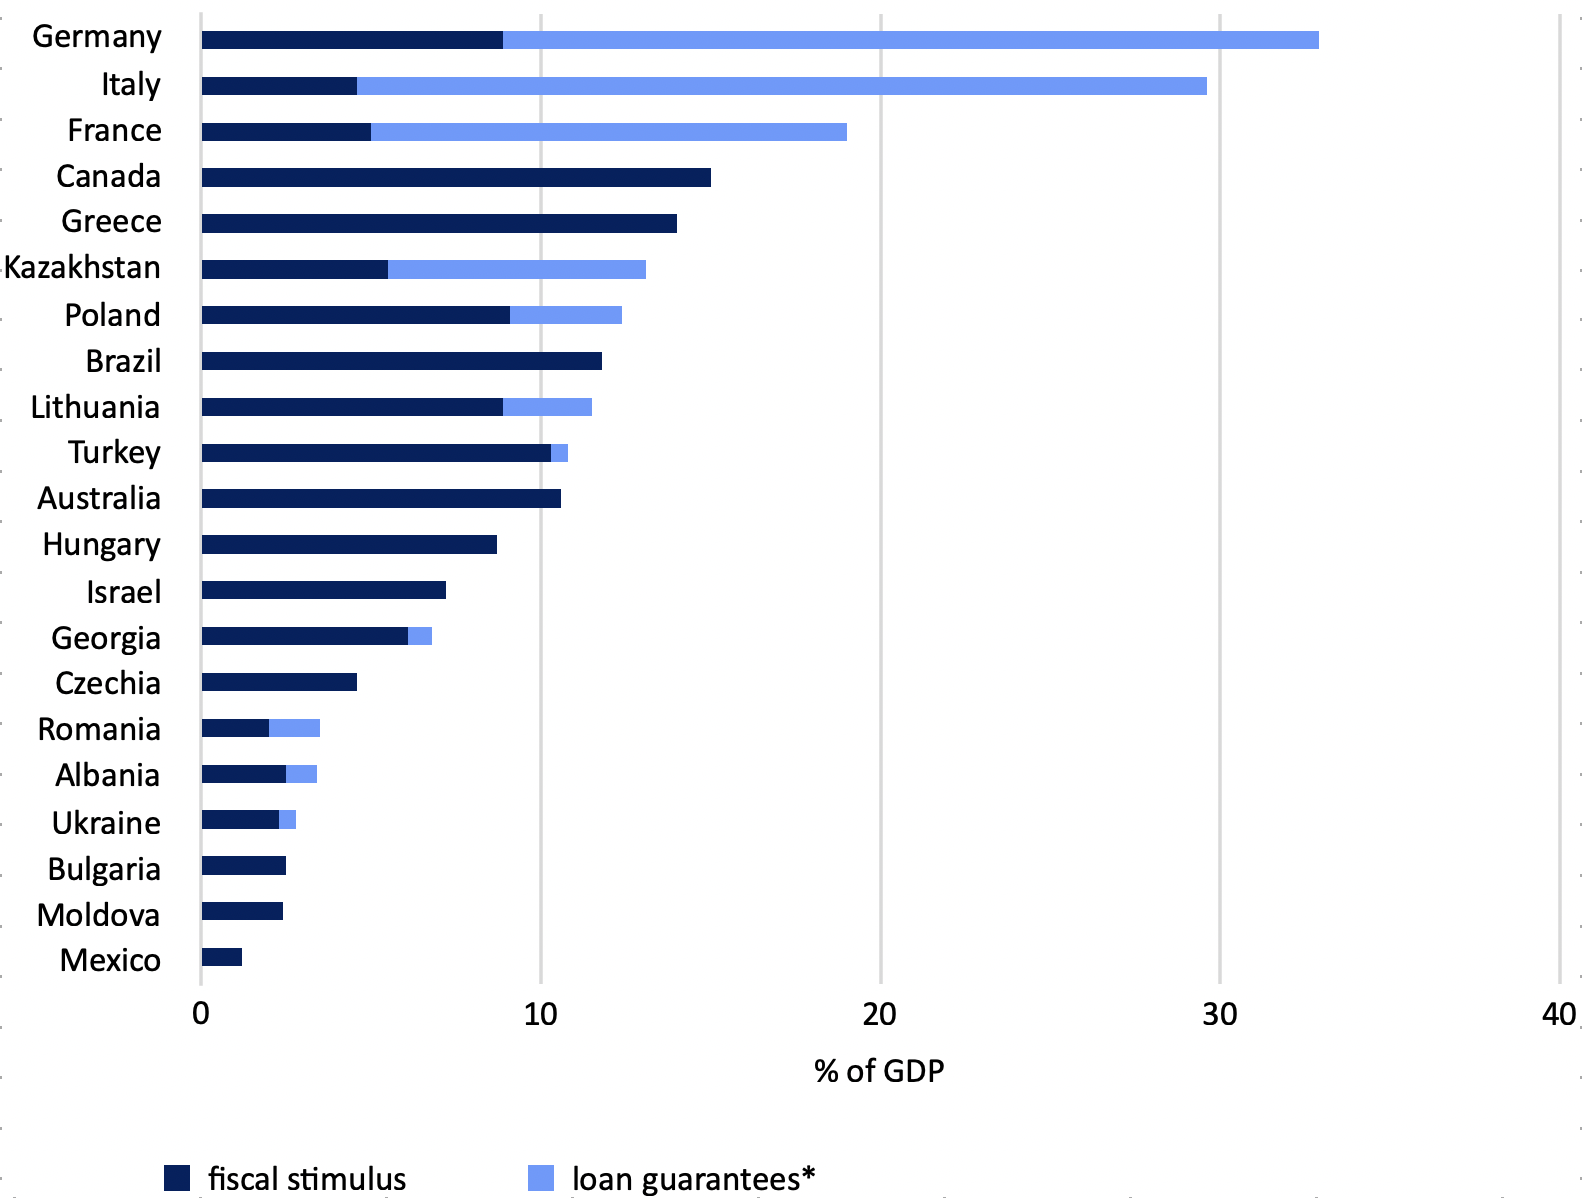
Sources: IMF World Economic Outlook, IMF Policy Responses to COVID-19 Tracker, websites of national state authorities.
* loan guarantees are separated from the other fiscal stimulus in cases where guarantees’ maximum potential volume was explicitly provided
Conclusion
We see that the packages of measures for different countries are quite similar, but the scale of these measures, especially fiscal ones, differs.
NBU monetary policy was in line with policies of most of its peers from other countries. The National Bank showed caution and commitment to macroeconomic stability by rejecting the option of quantitative easing, despite the political pressure. At the same time, while being more conservative than some other central banks from emerging markets, it supported the financial system and the domestic economy with quite a wide list of instruments.
Ukrainian fiscal policy compared to our selected countries is lagging behind. Obviously, richer countries have more capacity to borrow and spend. But poorer countries can get external help – from the IMF, other international organizations or foreign governments. Ukraine secured the IMF program ($5 billion) only in June 2020, although it could do that already in the late 2019. In the end of July, it sold a $2 billion Eurobond, which is still not enough for covering the expected 2020 budget deficit. During the current recession, Ukrainian government can finally apply a countercyclical fiscal policy – if it secures the support of international organizations – first of all the IMF which would open the door for other funding. However, the recent policy developments are rather worrisome. Thus, it is doubtful that the next IMF tranche will arrive this year. Unfortunately, Ukrainian households and firms should not expect much from the government.
Methodology
Country selection
First, we look at the set of other emerging European markets. Second, three emerging non-European countries are chosen for comparison. Third, we refer to several developed countries, from both Europe and the rest of the world.
Country losses
To measure how hard a country was hit by the pandemic, we use three dimensions. The first measure is the frequency of COVID-19 cases among the population together with the mortality rate from the disease. Secondly, we consider the stringency of lockdown measures. The third dimension of how severely a country has been struck by the pandemic is the “lost” economic growth. This is the difference between the rate of growth projected for 2020 at the end of 2019, i.e. what it could have been under normal circumstances, and the rate of growth projected for 2020 now (for consistency, we use IMF World Economic Outlook projections). For example, in October 2019 IMF expected Ukraine to grow by 3% in 2020. The last revision of this forecast published in June anticipates that Ukrainian economy will shrink by 8.2% in 2020. Therefore, Ukraine will have lost 11.2 percentage points of its GDP growth by the end of this year due to the pandemic.
Categorization of countries
We use ad hoc thresholds to categorize countries from our sample into three groups by each dimension (threshold values are given in the notes below the tables). We use “traffic light” colors to visually distinguish the countries along minesions. The predominance of red color points to the severely hurt countries: Brazil, Mexico, France and Italy (these countries are red or yellow in all dimensions). To the contrast, Greece has one of the lowest frequencies of COVID cases and deaths. Nevertheless it will lose a great portion of its growth due to very strict quarantine measures and the structure of the economy heavily dependent on tourism. The majority of emerging European countries are in the “green” or yellow zones across all dimensions and thus are affected relatively mildly. The surprising example is Moldova: with one of the highest share of infected population and deaths, it is expected not to lose much of GDP growth. Probably, the reason for this lies in the relatively high share of agriculture in the economy, which is the sector influenced least by the current crisis. Ukraine is characterized by one of the most significant GDP reductions among our sample countries.
* The IMF projection seems to be quite pessimistic: e.g., Ukraine’s government expects a slump of 4.8% in 2020, and the National Bank forecasts the reduction of 6.0%.


Attention
The authors do not work for, consult to, own shares in or receive funding from any company or organization that would benefit from this article, and have no relevant affiliations