Forbes presented the results of its own investigation, which showed a significant increase last year in the value of exports from the EU and the USA to countries neighboring Russia and closely economically connected to it. These are mainly the Central Asian countries that were formerly part of the USSR.
We decided to examine the commodity structure of EU exports to these countries and find out what contributed to the growth in trade. We identified gaps in economic sanctions that enable the supply of high-tech products to Russia.
In this article, we are only examining official statistics. It should be noted that some of the trade flows may pass through customs authorities and, therefore, may not be reflected in official sources of information.
Classifying Russia’s neighboring countries as significant trading partners of the EU is challenging since their share in the EU’s export structure is approximately 1%. However, it increased from 0.9% in 2021 to 1.2% in 2022. The notable intensification of cooperation against the backdrop of limited interaction between the EU and Russia raises logical questions about the nature of this growth in trade volumes.
Last year, EU countries increased their total exports of goods to the rest of the world by 18% (reaching 2.57 trillion euros) compared to 2021. Meanwhile, exports to Russia decreased by 38%. However, the trade flow between the EU and other neighboring countries of Russia (Azerbaijan, Belarus, Armenia, Georgia, Kazakhstan, Kyrgyzstan, Tajikistan, Turkmenistan, Uzbekistan) grew by 47% (see Figure 1).
Given that there is currently no single economic-political grouping that includes all of the mentioned neighboring countries of Russia, we will use the made-up term “CIS-9” to refer to these countries in the text. This term is provisional because, in practice, the Commonwealth of Independent States (CIS) includes Azerbaijan, Belarus, Armenia, Kazakhstan, Kyrgyzstan, Moldova, Russia, Tajikistan, and Uzbekistan as members, with Turkmenistan as an associate member, and Georgia as a former member.
Figure 1. Goods export volumes from the EU to the CIS-9, euros
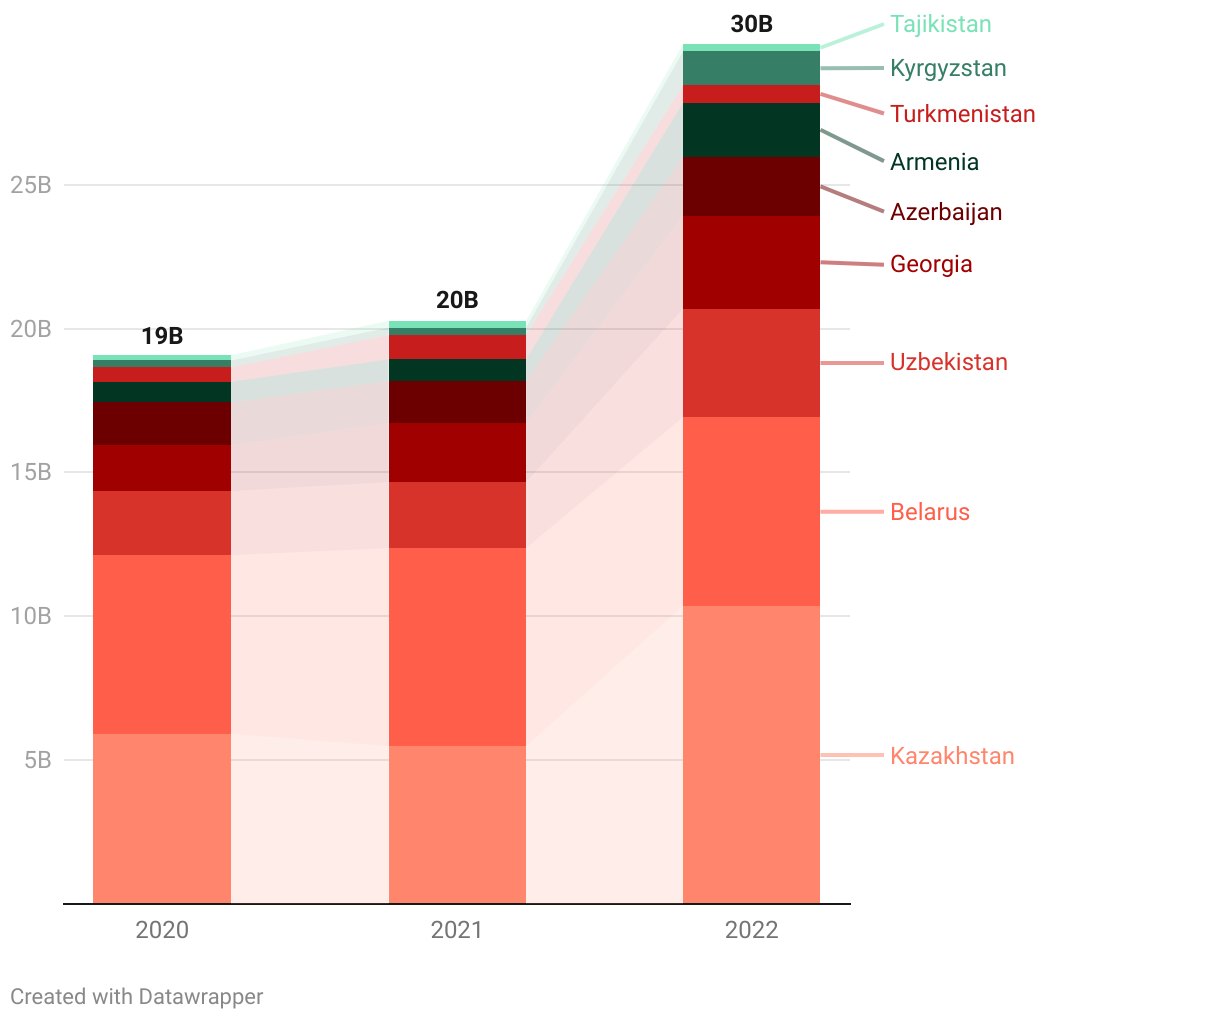
Source: Eurostat
The growth engines were Kazakhstan (+89%), Uzbekistan (+64%), Georgia (+58%), and Armenia (+149%). Additionally, noticeable changes occurred in EU trade with Kyrgyzstan, as exports to this country increased by over fourfold. At the same time, two countries from the CIS-9 group, Belarus and Turkmenistan, reduced their imports of goods from the EU.
The largest increase in exports to these countries came from Germany and Lithuania, with an increase of 3 billion euros or 66% and 1.6 billion euros or 95%, respectively. Other countries, such as Poland, the Netherlands, France, and the Czech Republic, increased their exports to the CIS-9 by more than 600-800 million euros each (see Figure 2).
Figure 2. Absolute increase in export from the EU-27 to Russia’s neighboring countries, Euros
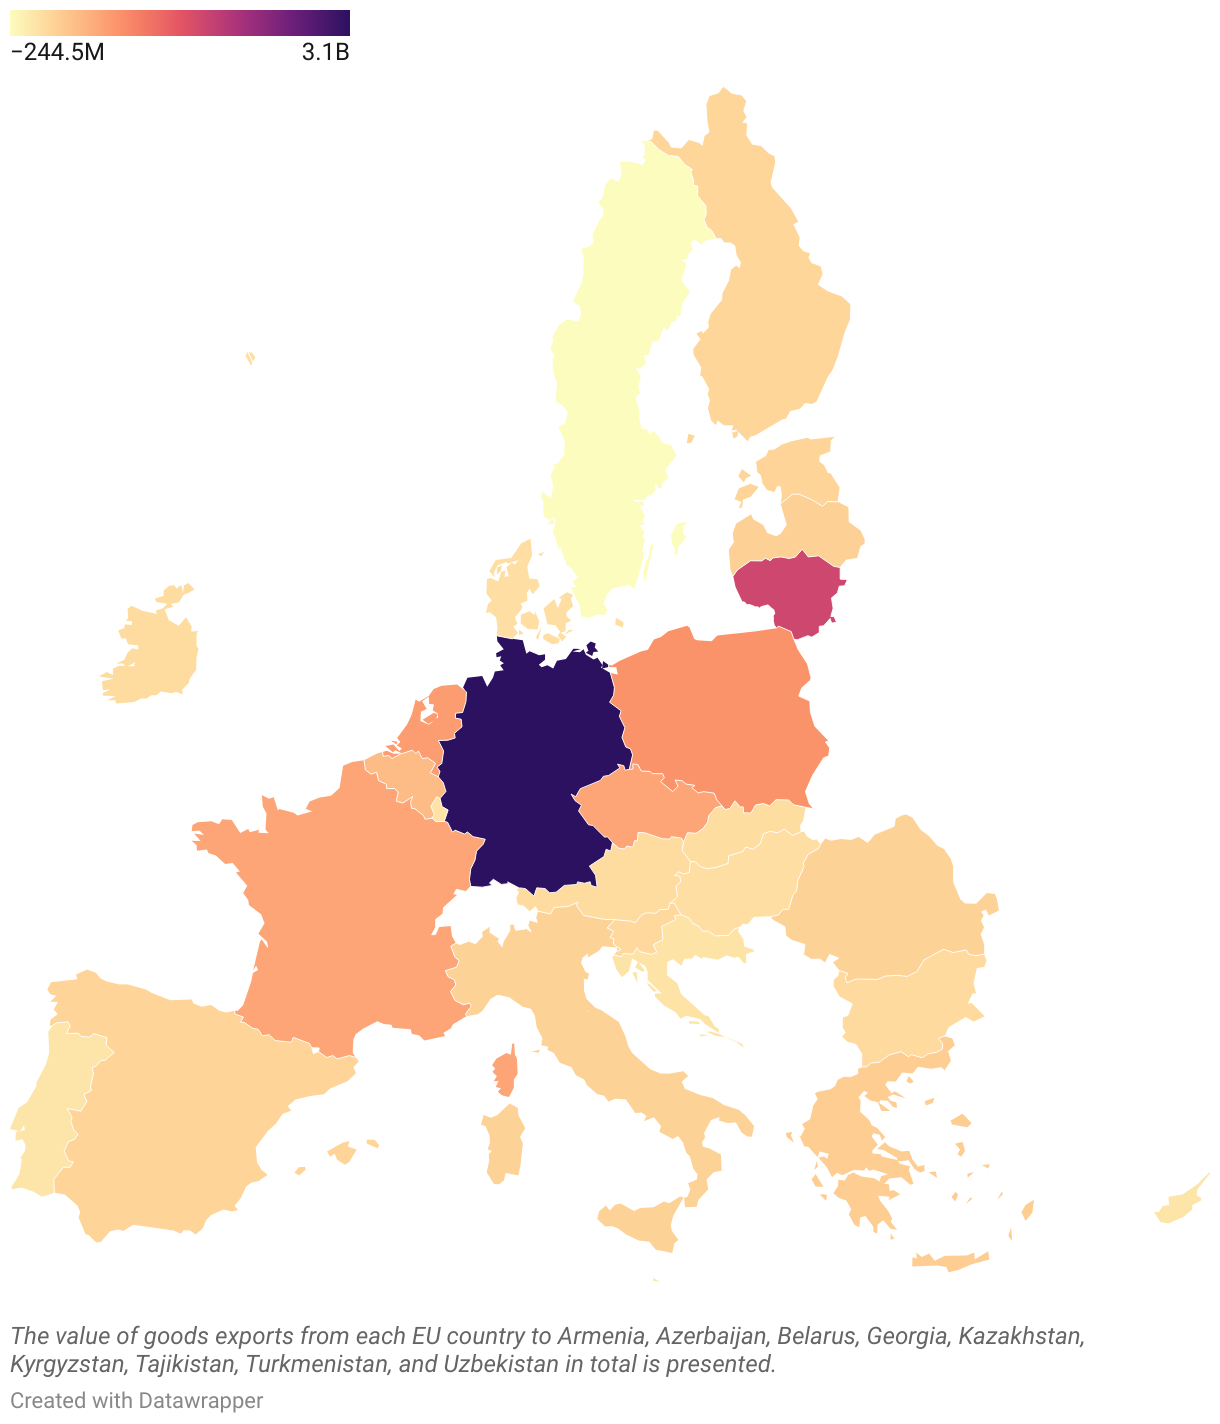
Source: Eurostat
Over the past three years, high-tech products have been key export items from the EU to the rest of the world. This includes product groups 84 “Nuclear reactors, boilers, machinery, and mechanical appliances; parts thereof,” 30 “Pharmaceutical products,” 87 “Vehicles other than railway or tramway rolling stock, and parts and accessories thereof,” and 85 “Electrical machinery and equipment and parts thereof; sound recorders and reproducers; television image and sound recorders and reproducers, parts, and accessories.”
Russia’s neighboring countries also predominantly imported this type of products from the EU. Let’s take a closer look at the specific products that drove significant growth in trade volume in 2022.
Eurostat data showed that the growth last year was mainly driven by the top 10 product groups (see Figure 3). These primarily include the export of passenger cars to Belarus and Kazakhstan, computer equipment (laptops, memory devices), engines, turbines, and combines to Kazakhstan, aircraft to Uzbekistan, and computer equipment, passenger cars, electrical equipment, monitors, phones, and more to Armenia.
Figure 3. Top 10 product groups that contributed to the increase in EU exports to Russia’s neighboring countries in 2022 and export volumes in 2021, Euros
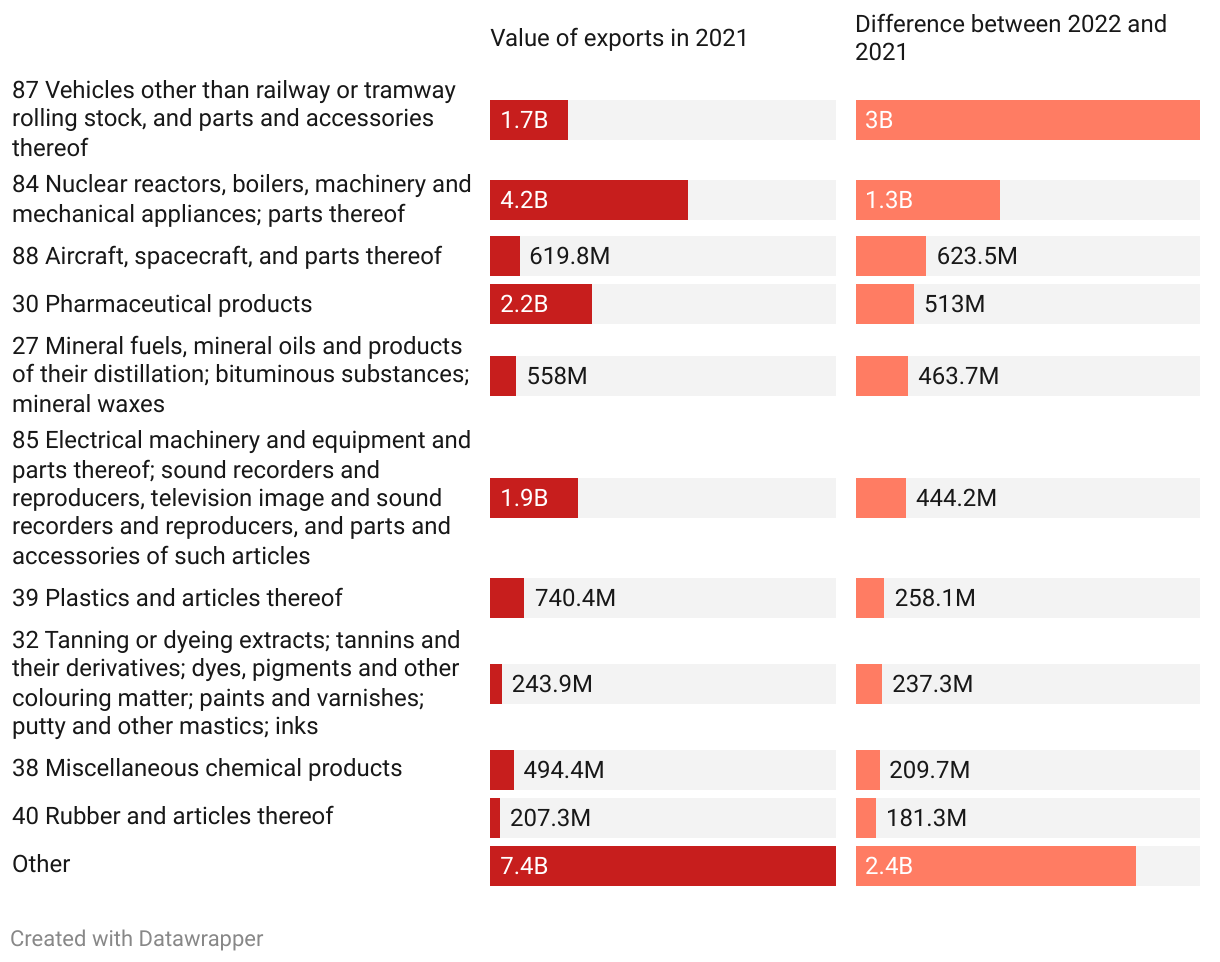
Source: Eurostat
Note: Growth is presented as the difference between the volumes of exports of the respective products in 2022 compared to 2021.
In addition to domestic consumption in the importing countries, the significant growth in the import of technological products may indeed be related to parallel imports into Russia of goods that Western manufacturers have stopped supplying to the Russian market, including vehicles and computer technology, among others. To confirm this hypothesis, we examined changes in the volumes of exports from neighboring countries to Russia.
For reference, Russia ceased publishing detailed statistical data on external trade in 2022 following the start of the full-scale invasion. The Federal Customs Service of Russia began partially reporting on external trade volumes in March 2023; however, we were unable to access the data due to the blocking of the authority’s website. Therefore, we are using mirrored data on trade flows from countries that have maintained public access to statistics.
Furthermore, countries that did not provide information about their results for 2022 were not taken into account in the calculations, such as Belarus, Vietnam, certain Latin American countries (Jamaica, Honduras, etc.), Africa, and the Middle East (Saudi Arabia, UAE, Iran, Oman, etc.). Therefore, the results for 2021 for these countries are also not considered.
According to the mirror data from the International Trade Centre (i.e., data from exporting countries that reported trade volumes), last year, Russia imported a total of $194 billion of goods, which is a 21% decrease compared to 2021. The decline is associated with a reduction in the inflow of goods from EU countries (especially Germany), the United Kingdom, North America, South Korea, Japan, and others. These countries do not tolerate Ukraine’s military invasion and have imposed sanctions on the aggressor.
Figure 4. Top 10 exporters to Russia in 2021 and 2022, $
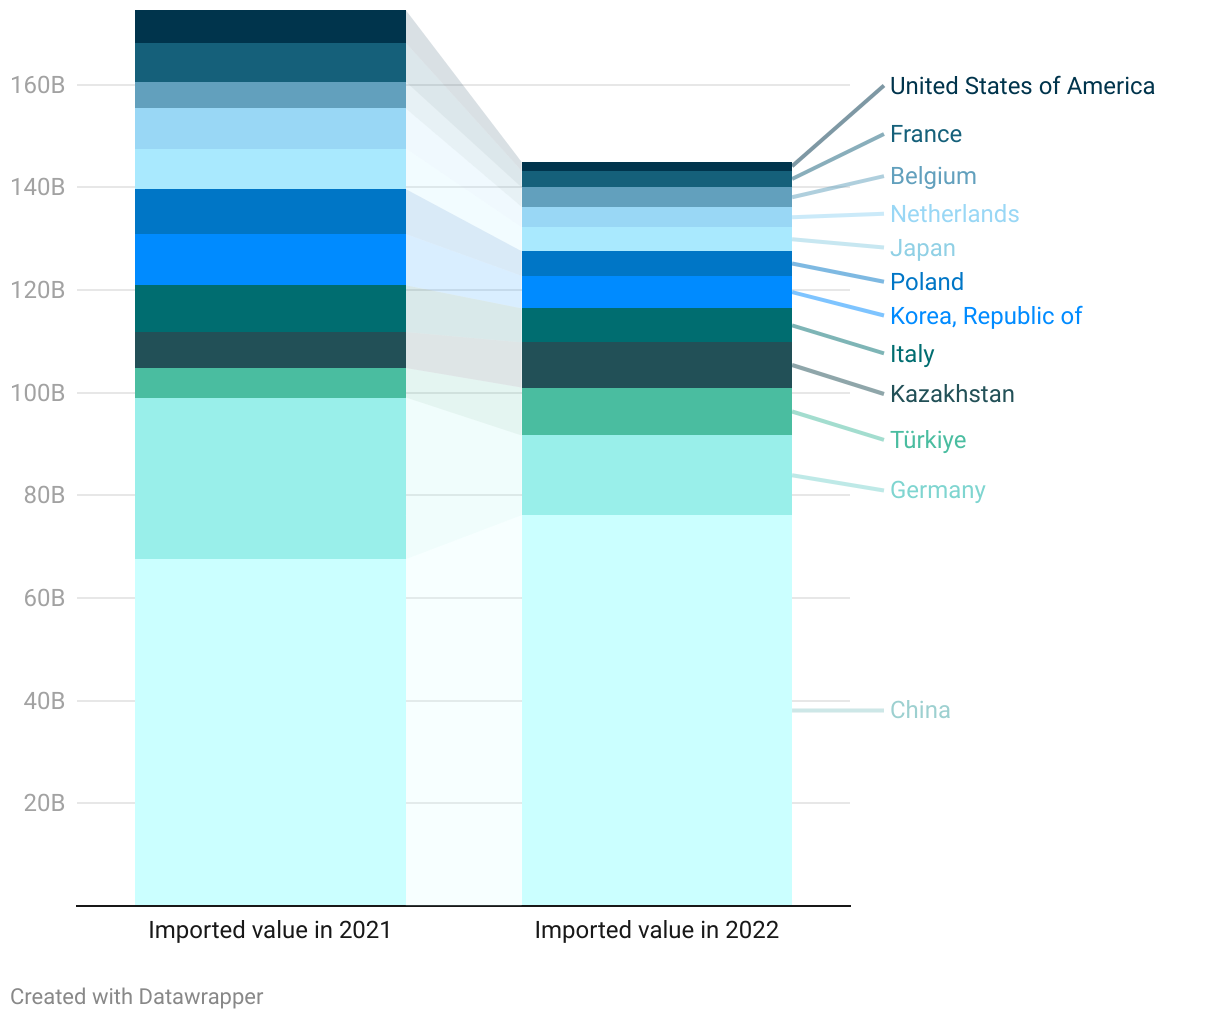
Source: Intracen
However, the data also demonstrate a significant increase in trade flows to Russia from post-Soviet and Global South countries (see Figure 5). As Russia’s largest trading partner, China continued to increase its exports to Russia, albeit at a slower pace than in 2021. Turkey also took the opportunity to boost its trade relations, which could potentially serve as a transit hub for parallel imports of restricted goods into Russia, along with countries like Kazakhstan, Armenia, Uzbekistan, and Kyrgyzstan.
Figure 5. Export volumes to Russia by the top 10 countries that increased trade, $
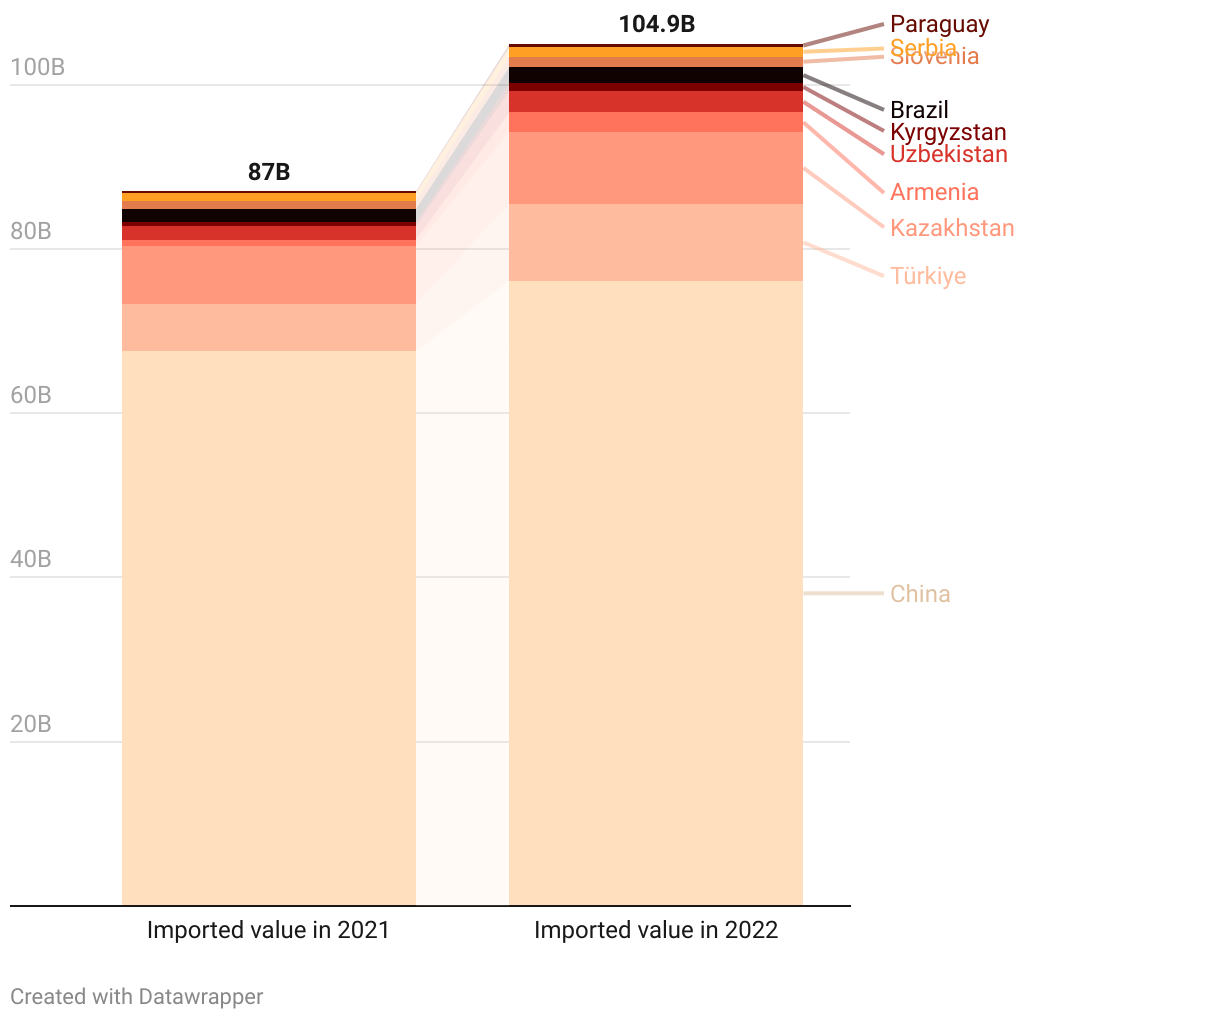
Source: Intracen
Note: The ranking of countries is based on the growth of their exports to Russia in 2022. Therefore, this country list does not coincide with the list of the largest exporters to Russia (see Figure 4). For instance, Germany occupied the second position among Russia’s trading partners last year, following China. However, the volume of imports from this country halved, so it did not appear in Figure 5.
Let’s further examine the products through which Russia increased its imports from its neighbors.
Kazakhstan, Armenia, Uzbekistan, and Kyrgyzstan increased their exports of goods to Russia, including high-tech products from the same product groups whose imports grew from the EU (see Figure 6). An exception is a significant increase in the import of aircraft into Uzbekistan, as there is no visible re-export to Russia based on available data (which is understandable since it is not easy to “quietly” resell an aircraft).
Figure 6. Exports of CIS-9 countries to Russia, $
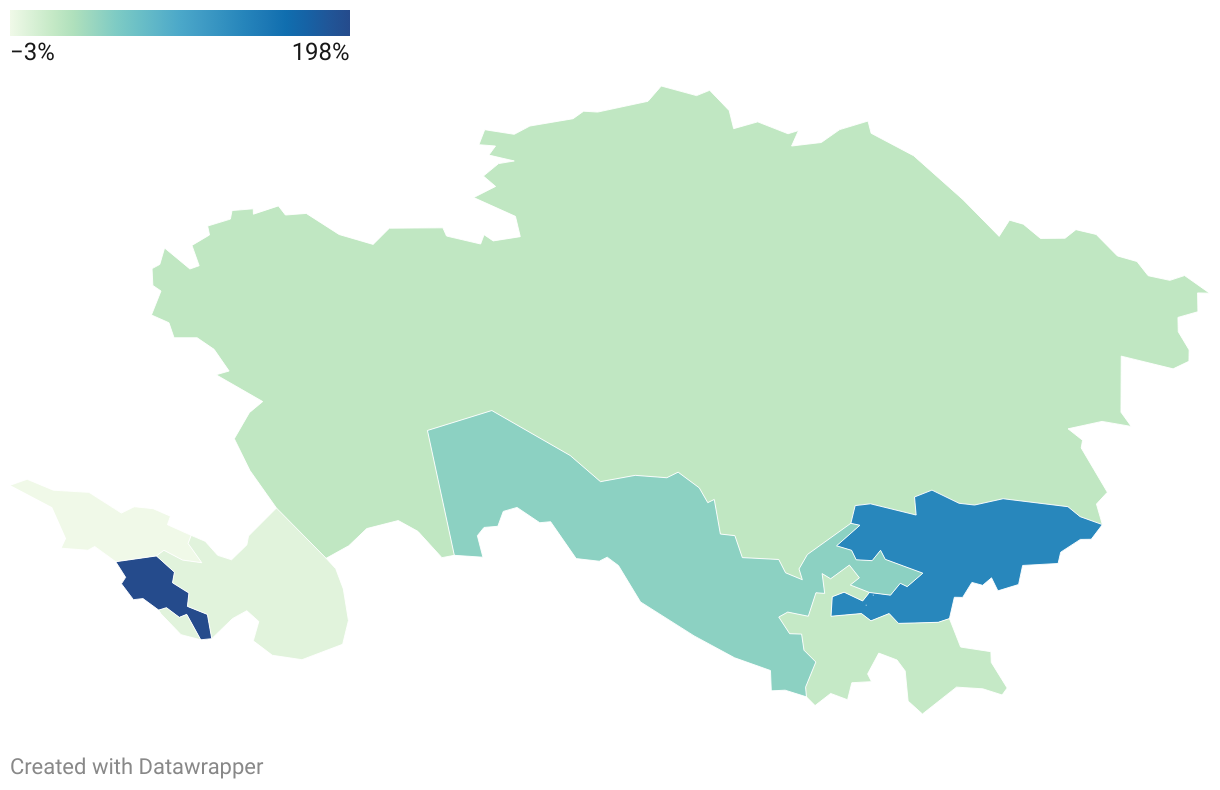
Source: Intracen
Note: Detailed information on export volumes by product category is provided in the tables in the appendix.
We cannot assert that only these export categories became the main drivers of its growth, as traditional products for these economies (e.g., cotton and light industrial products from Uzbekistan and Kyrgyzstan, or ore and chemical products from Kazakhstan) still formed the basis of trade flows from neighboring countries to Russia. However, the anomalous increase in the movement of technological goods along the EU – Russia’s neighbors – Russia route vividly illustrates the rapid establishment of alternative trade routes to circumvent sanctions.
What is happening in 2023?
During the first half of the year, the volume of exports from the EU to the CIS-9 countries exceeded the figure for the first half of 2022 by 71%, reaching 18.3 billion euros. However, the more critical comparison is with the second half of the previous year when economic measures against Russia in response to the military invasion began to take effect. Thus, in the first half of 2023, exports of goods from the European Union to the CIS-9 are only 5% behind the volume of the second half of the previous year.
The trade flow primarily comprises the same goods, with some categories (such as vehicles) demonstrating further export growth (see Figure 7). However, there are also export categories that have significantly declined, such as the supply of aircraft and mineral fuels.
Figure 7. Top 10 export items from the EU to the CIS-9, Euros.
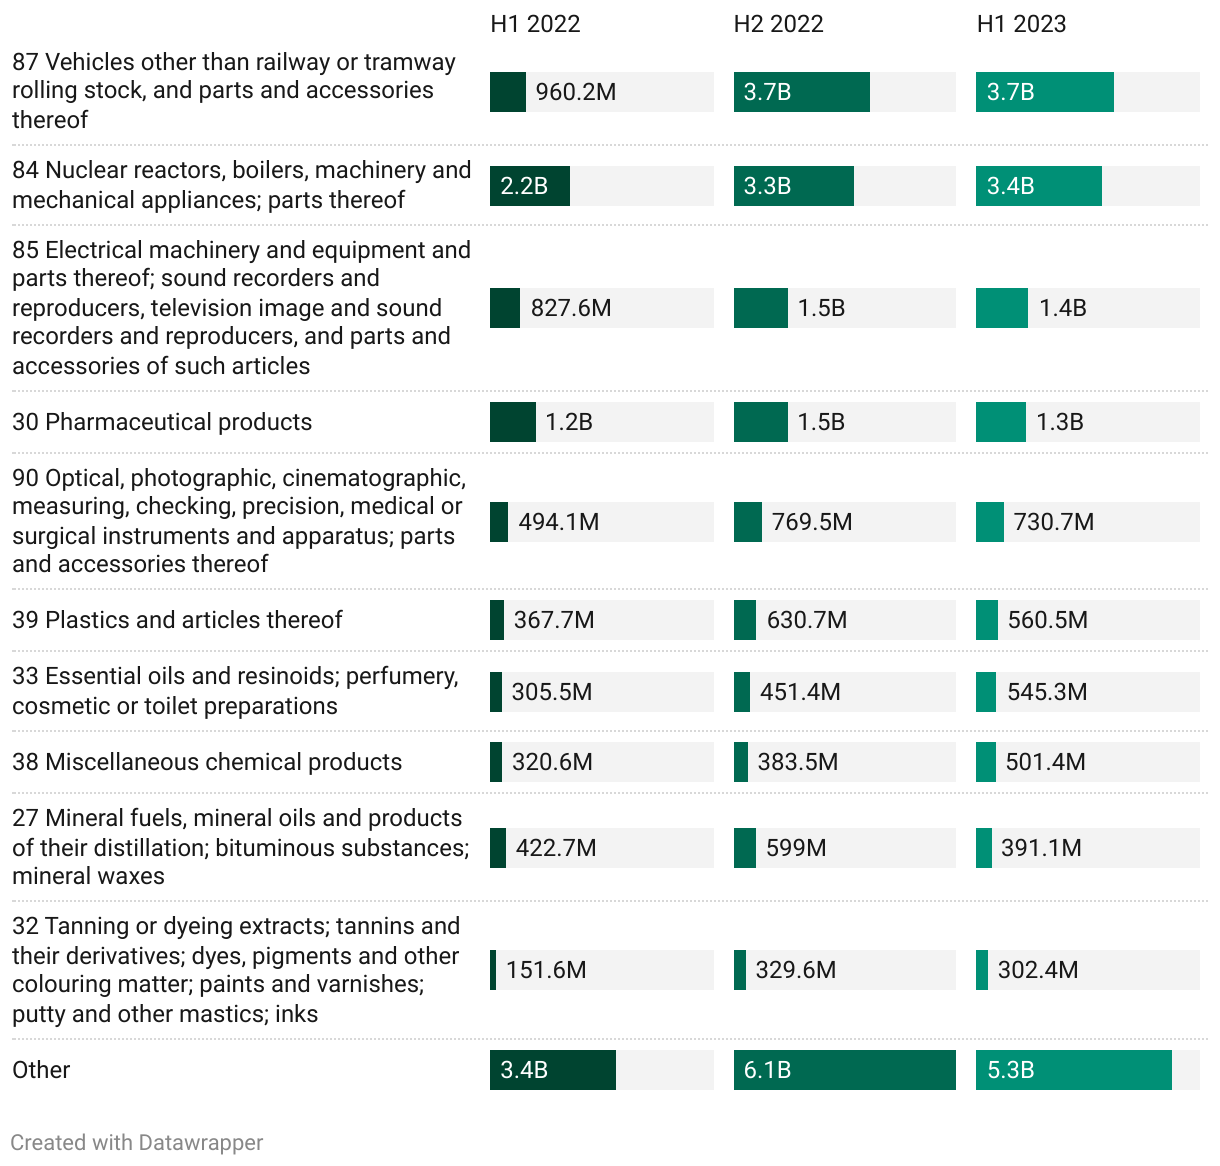
Source: Eurostat
It appears that EU countries are indeed supplying sanctioned goods to Russia through neighboring countries, primarily Central Asian countries that were part of the former USSR. This is unlikely to be a well-kept secret from the respective governments, as these data are publicly available. However, enforcing sanctions is much more challenging than imposing them because it requires tracking the compliance of government acts and applying measures of influence to companies that supply prohibited goods to Russia. Failing to do so could prolong the war indefinitely.
Appendix
Table 1. Export of goods from Kazakhstan to Russia in 2021-2022, $
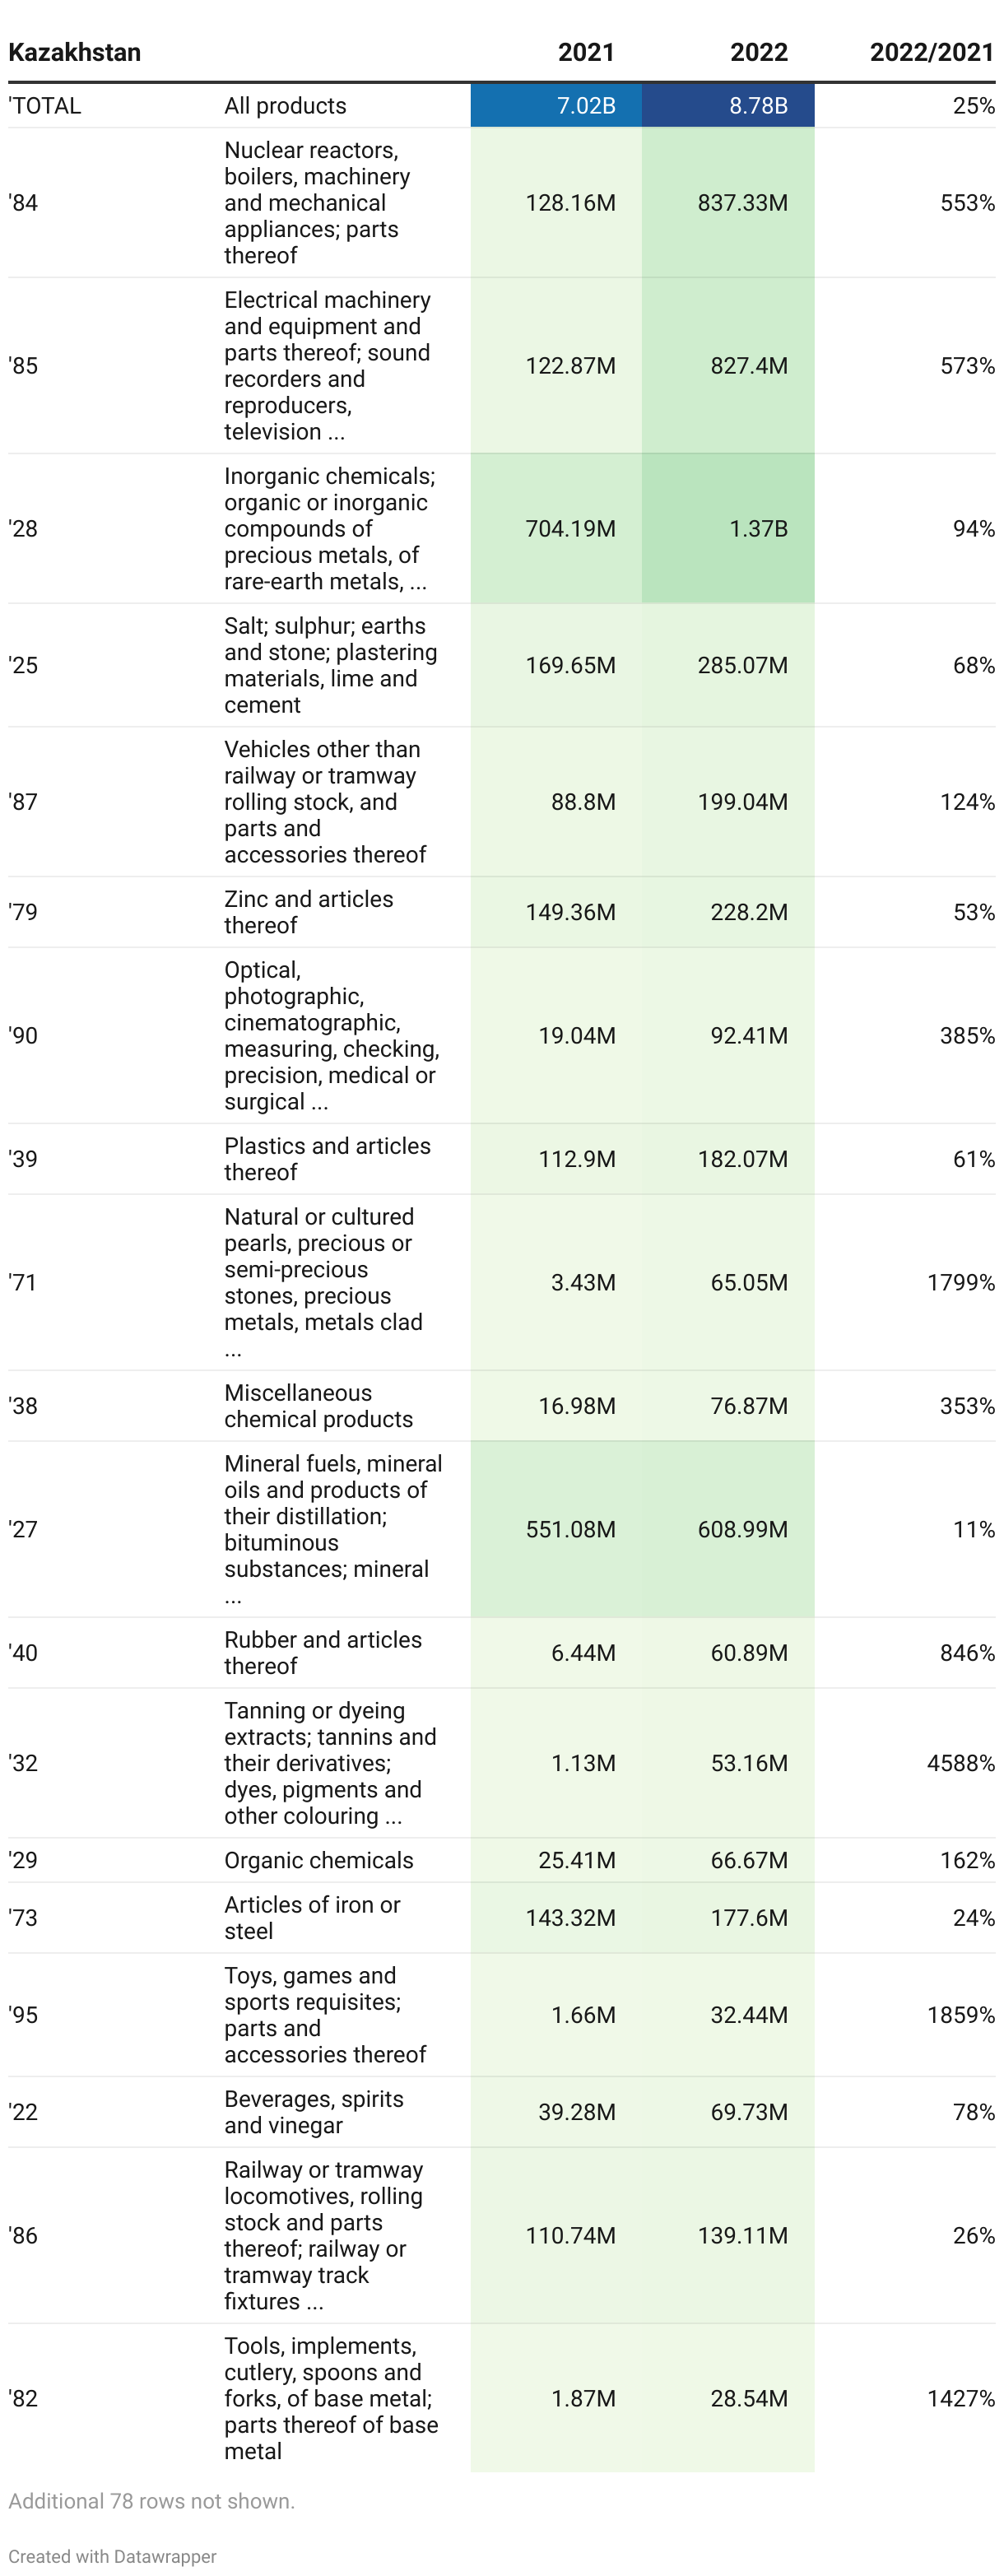
Table 2. Export of goods from Uzbekistan to Russia in 2021-2022, $
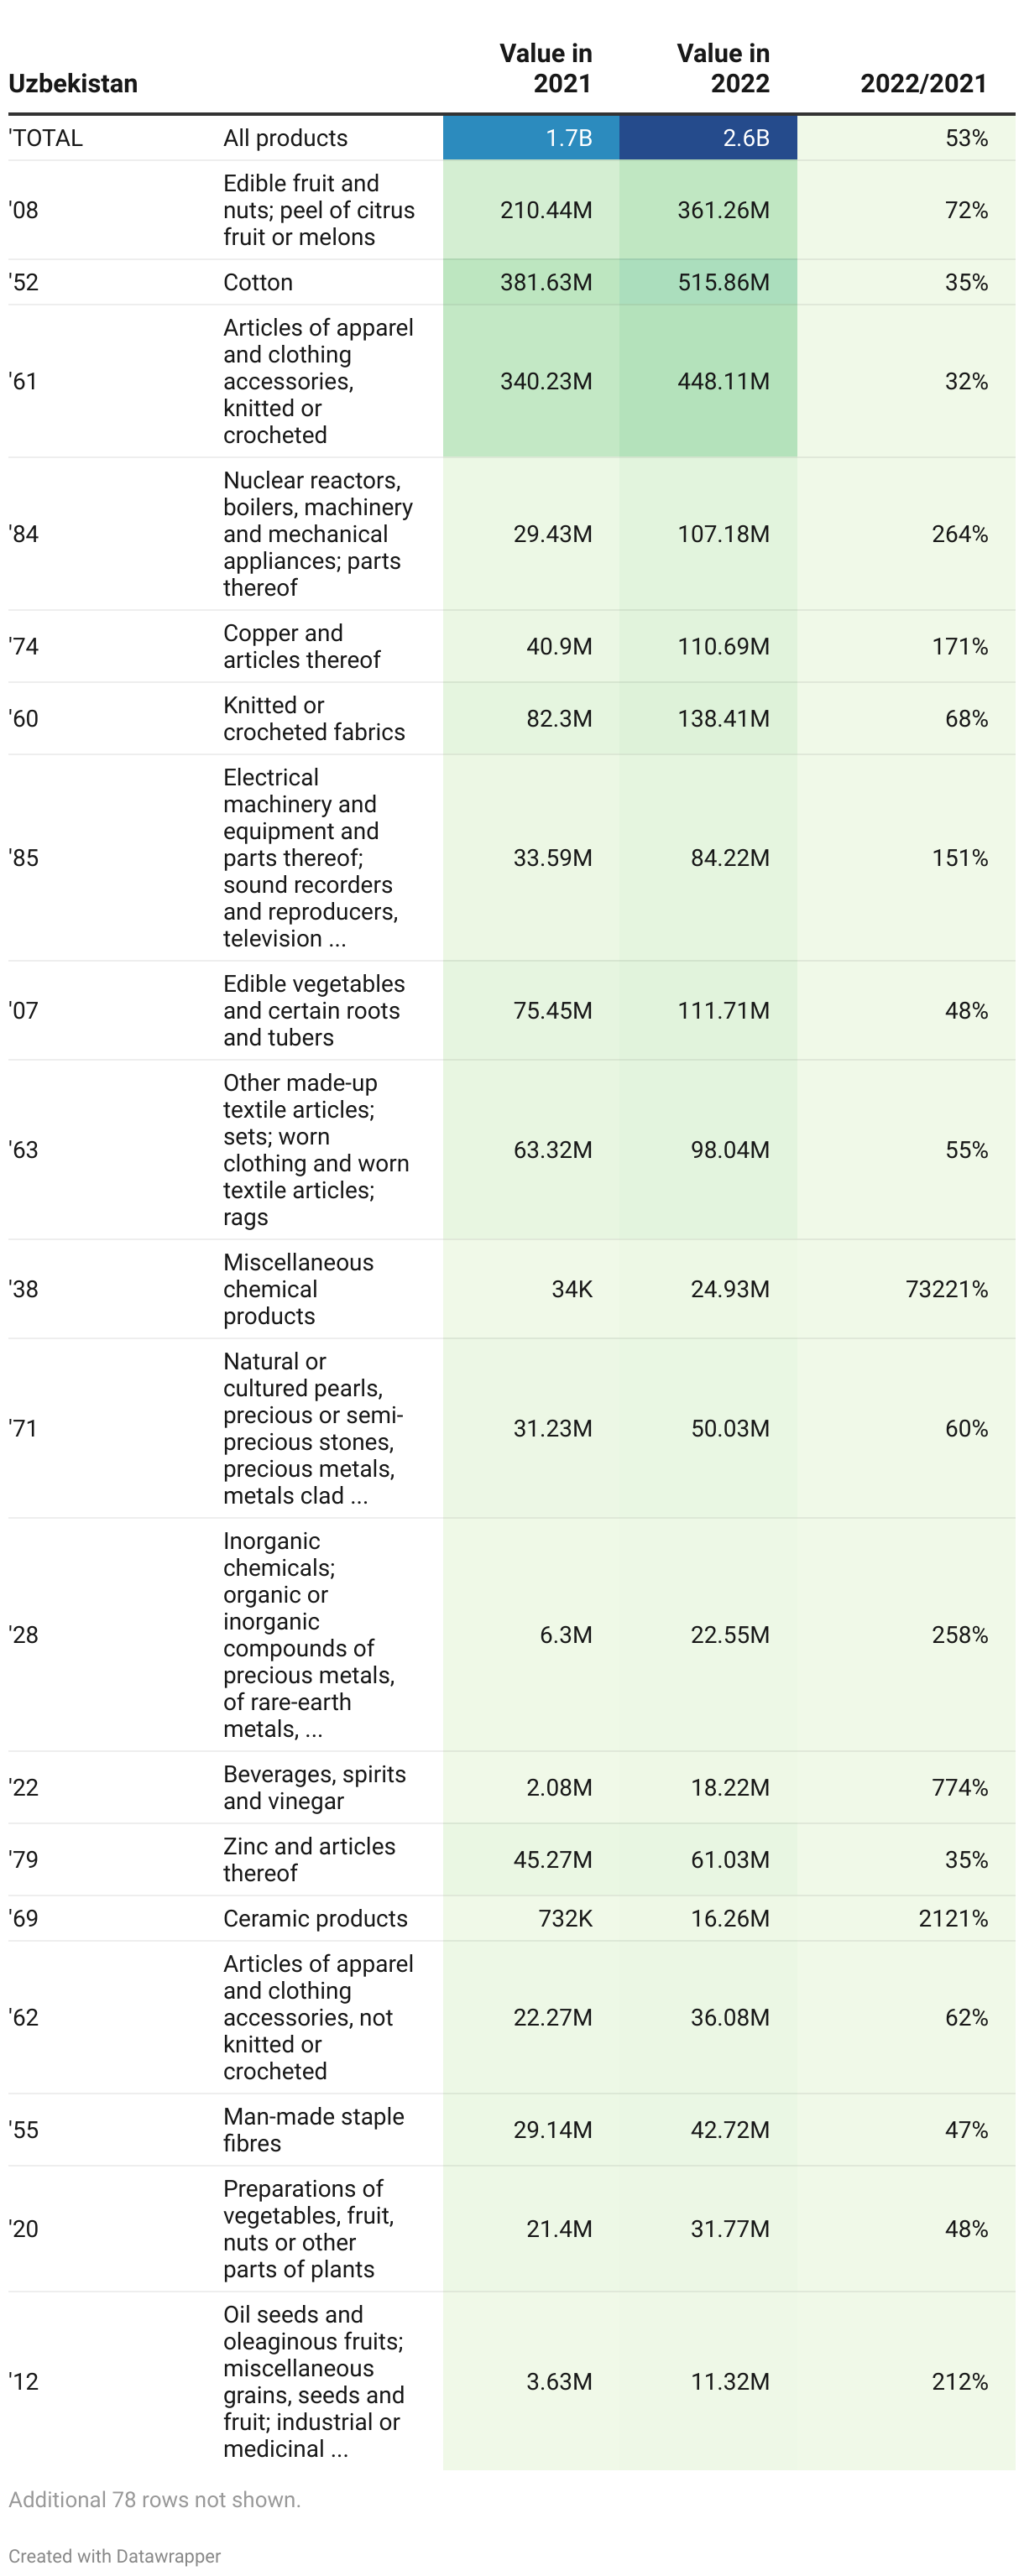
Table 3. Export of goods from Armenia to Russia in 2021-2022, $
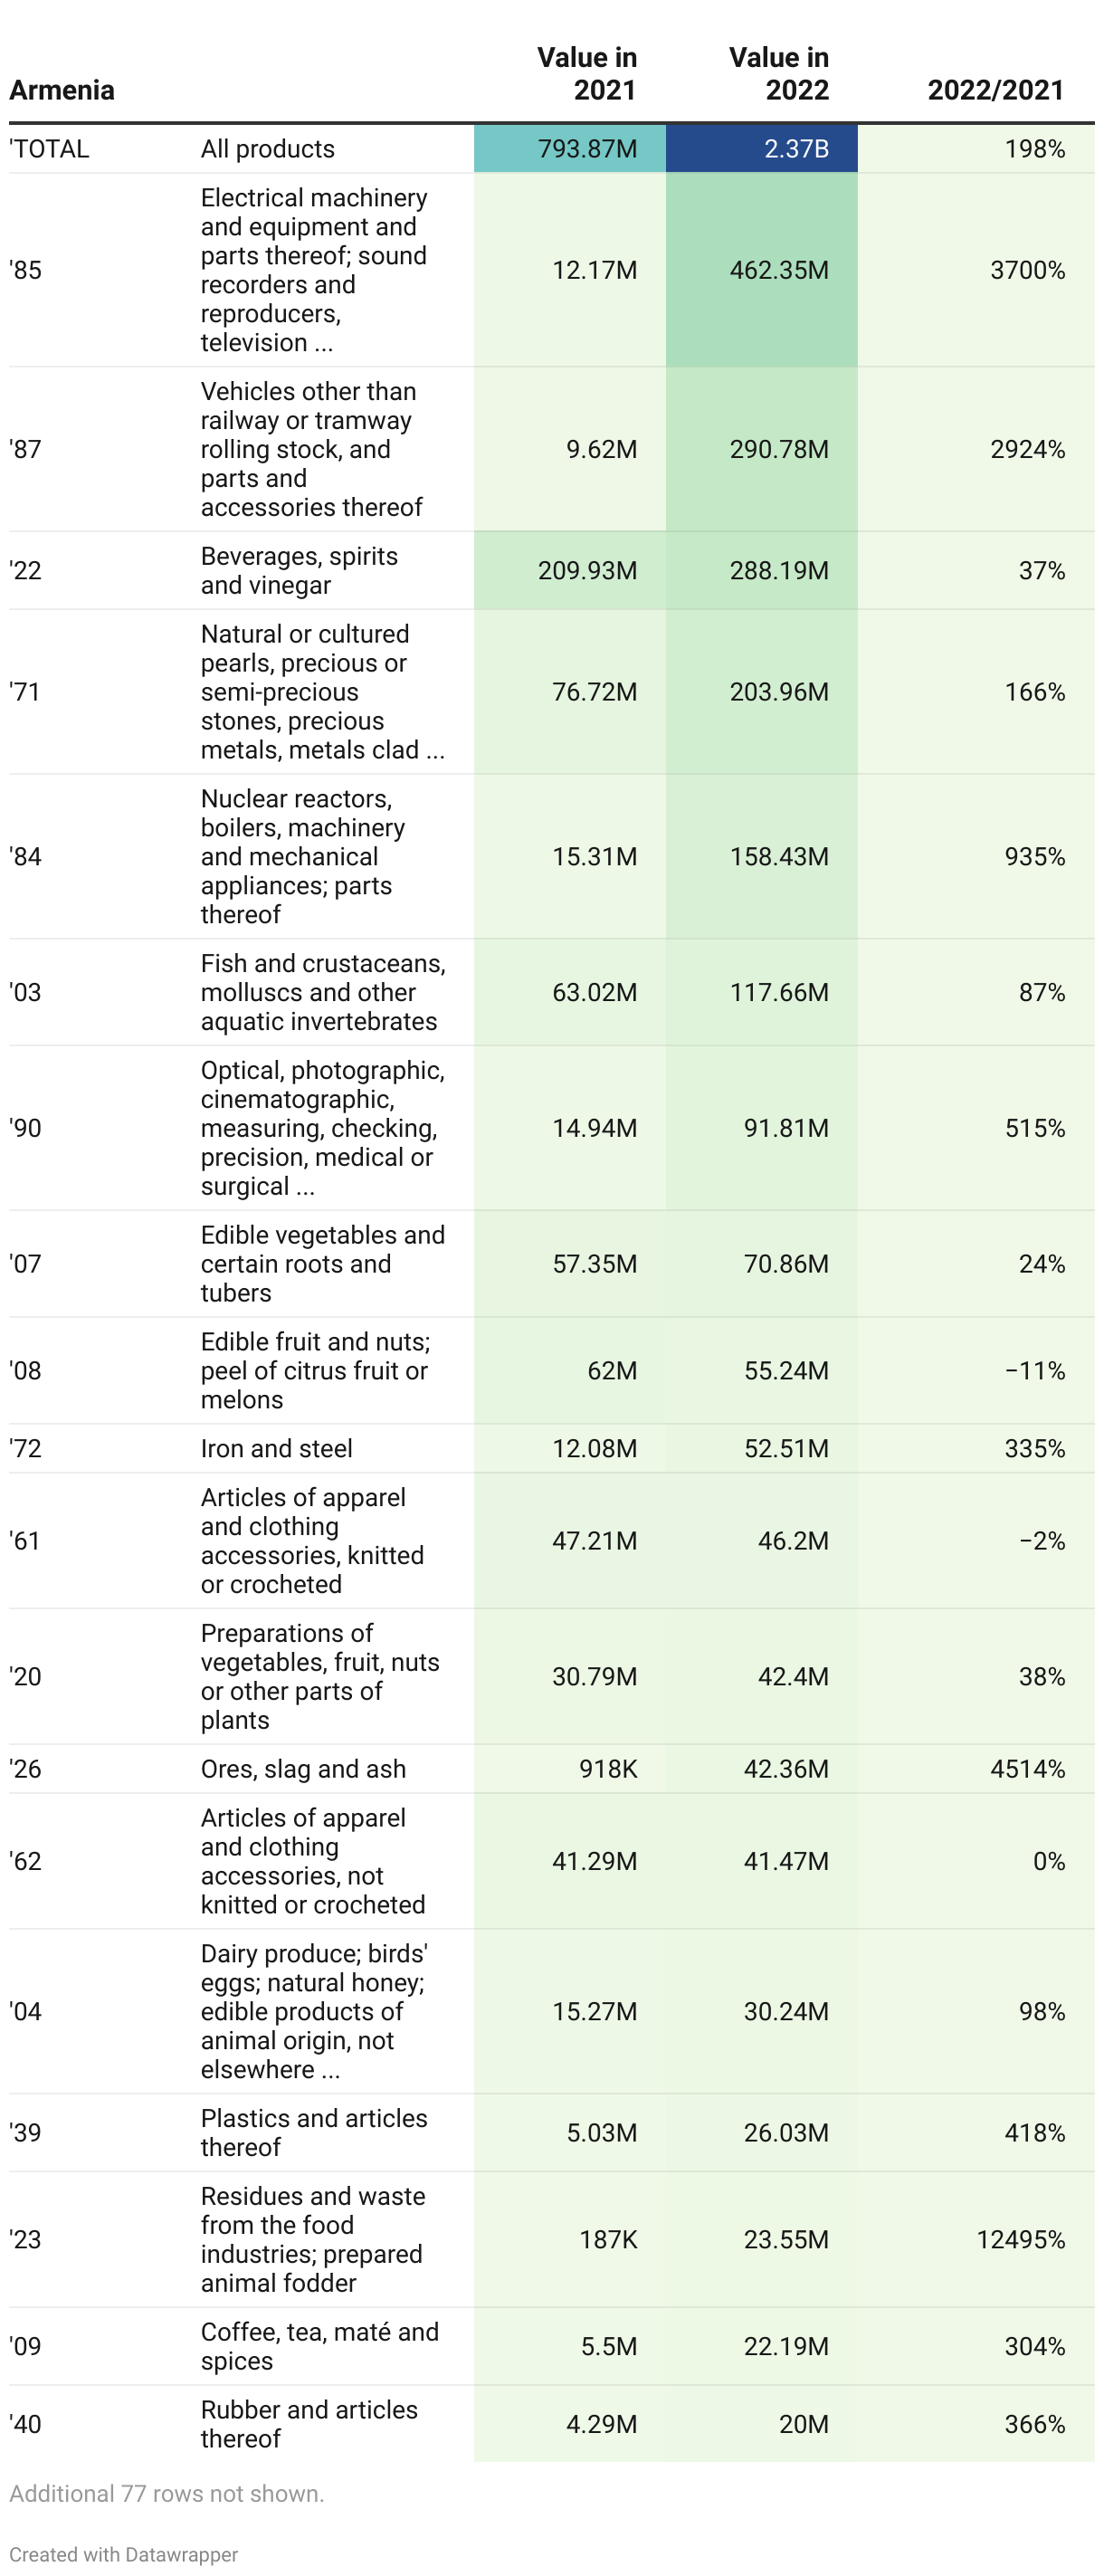
Table 4. Export of goods from Azerbaijan to Russia in 2021-2022, $
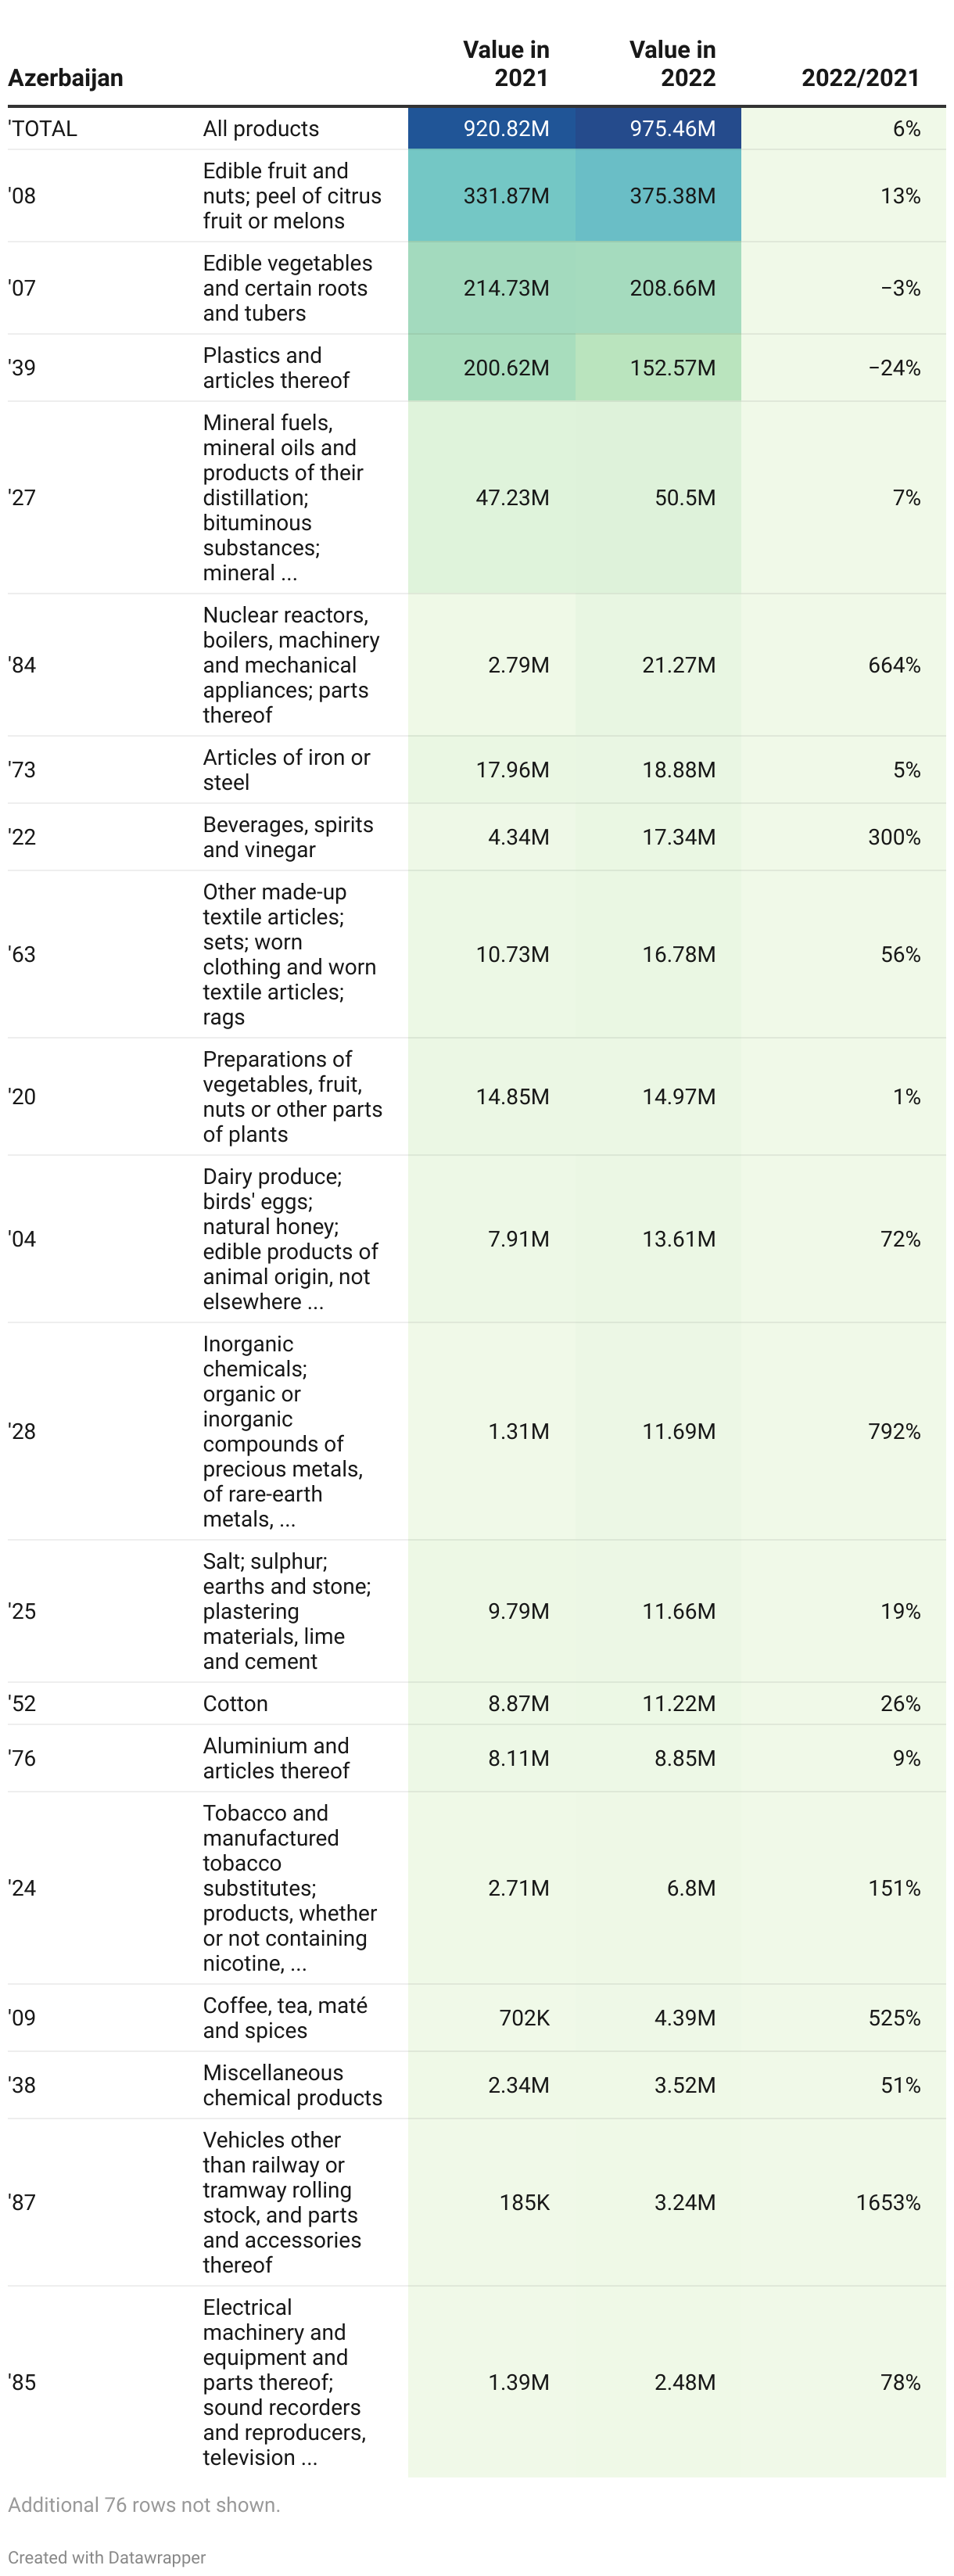
Table 5. Export of goods from Kyrgyzstan to Russia in 2021-2022, $
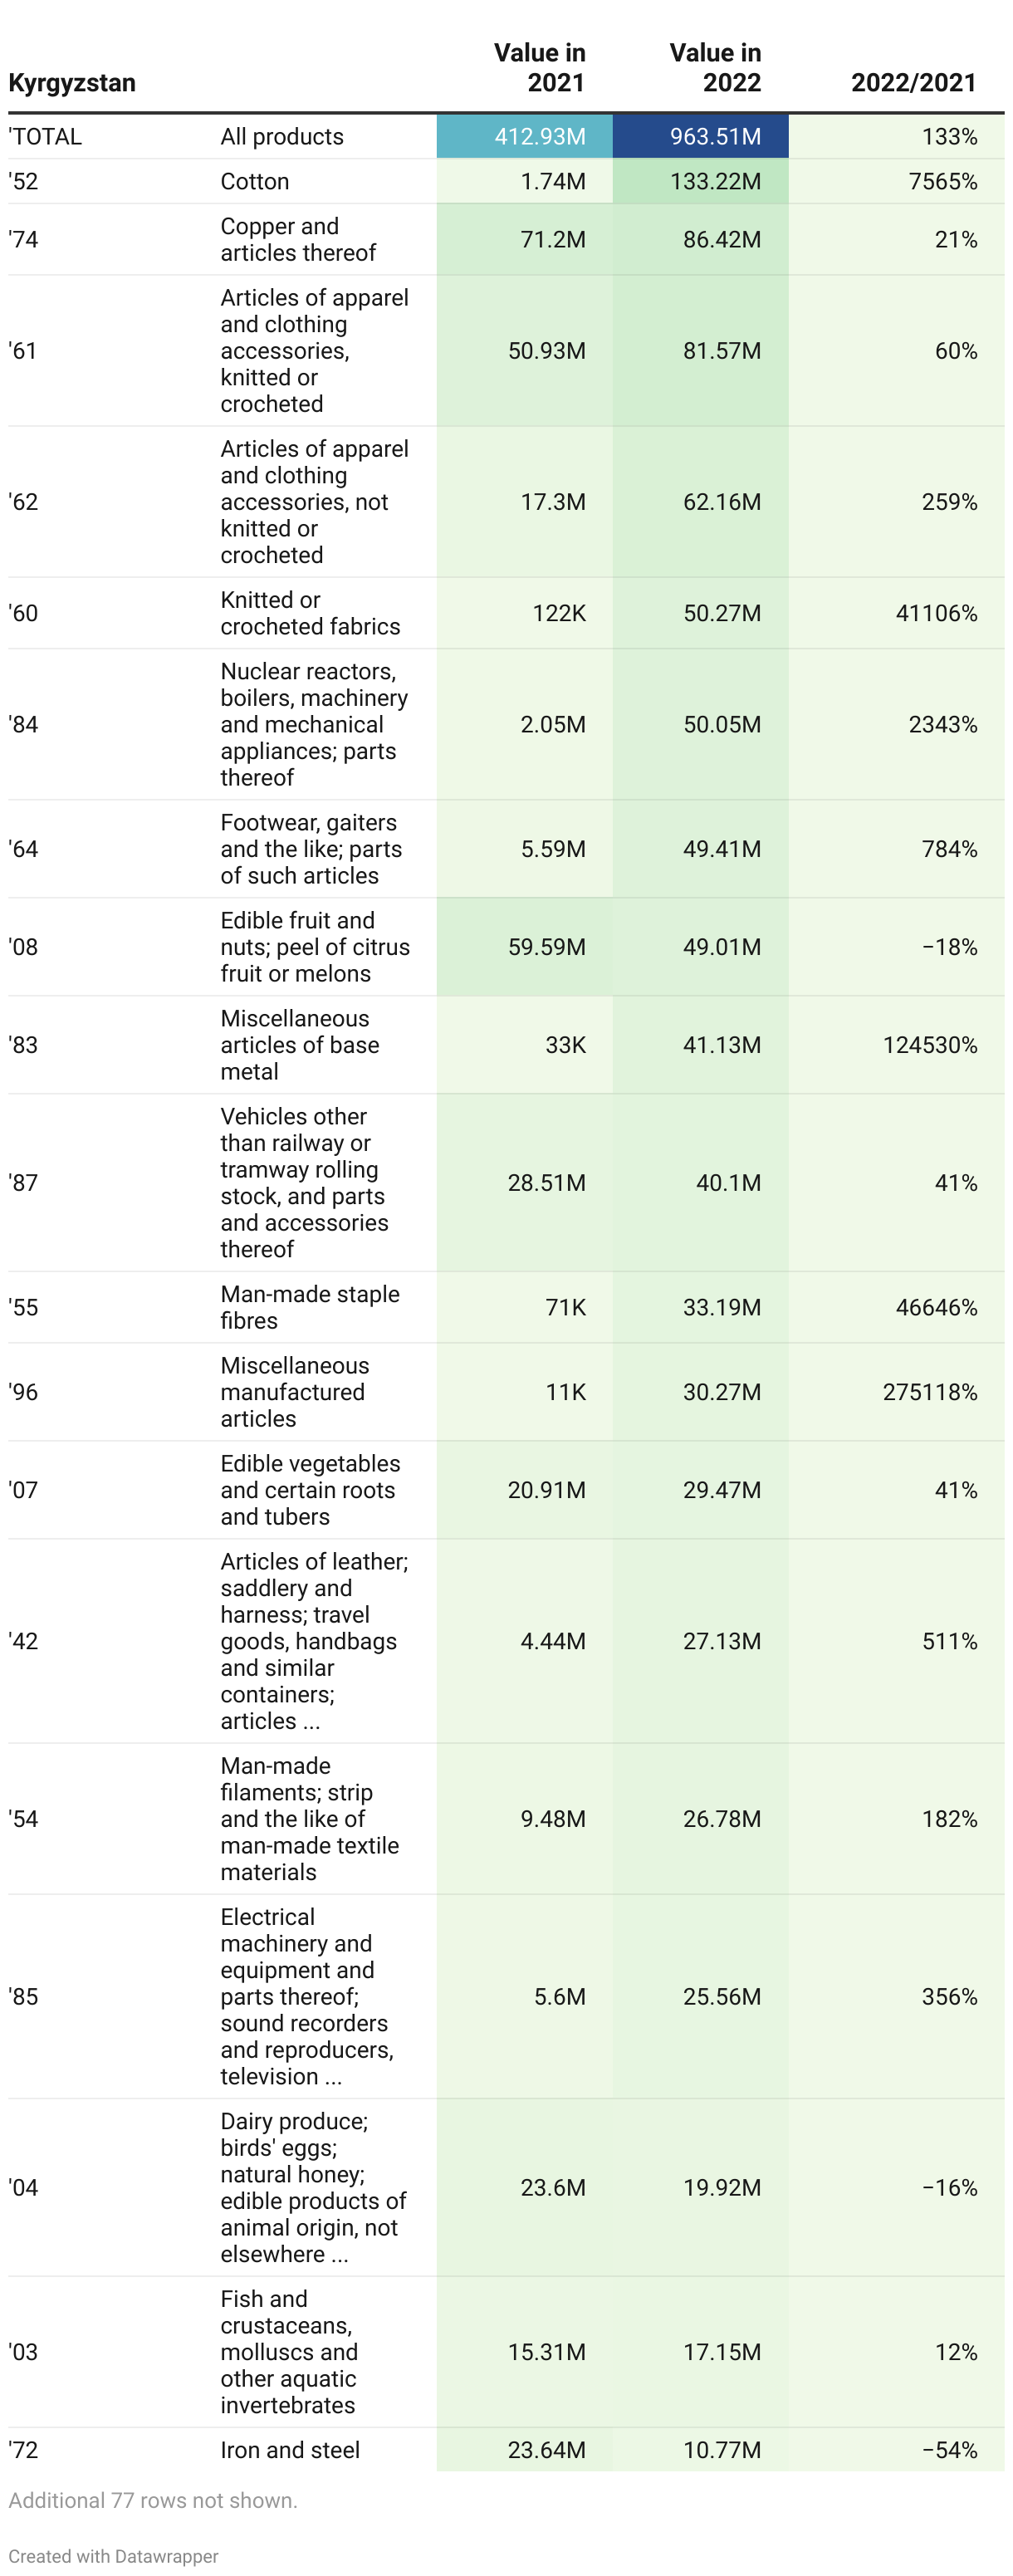
Table 6. Export of goods from Georgia to Russia in 2021-2022, $
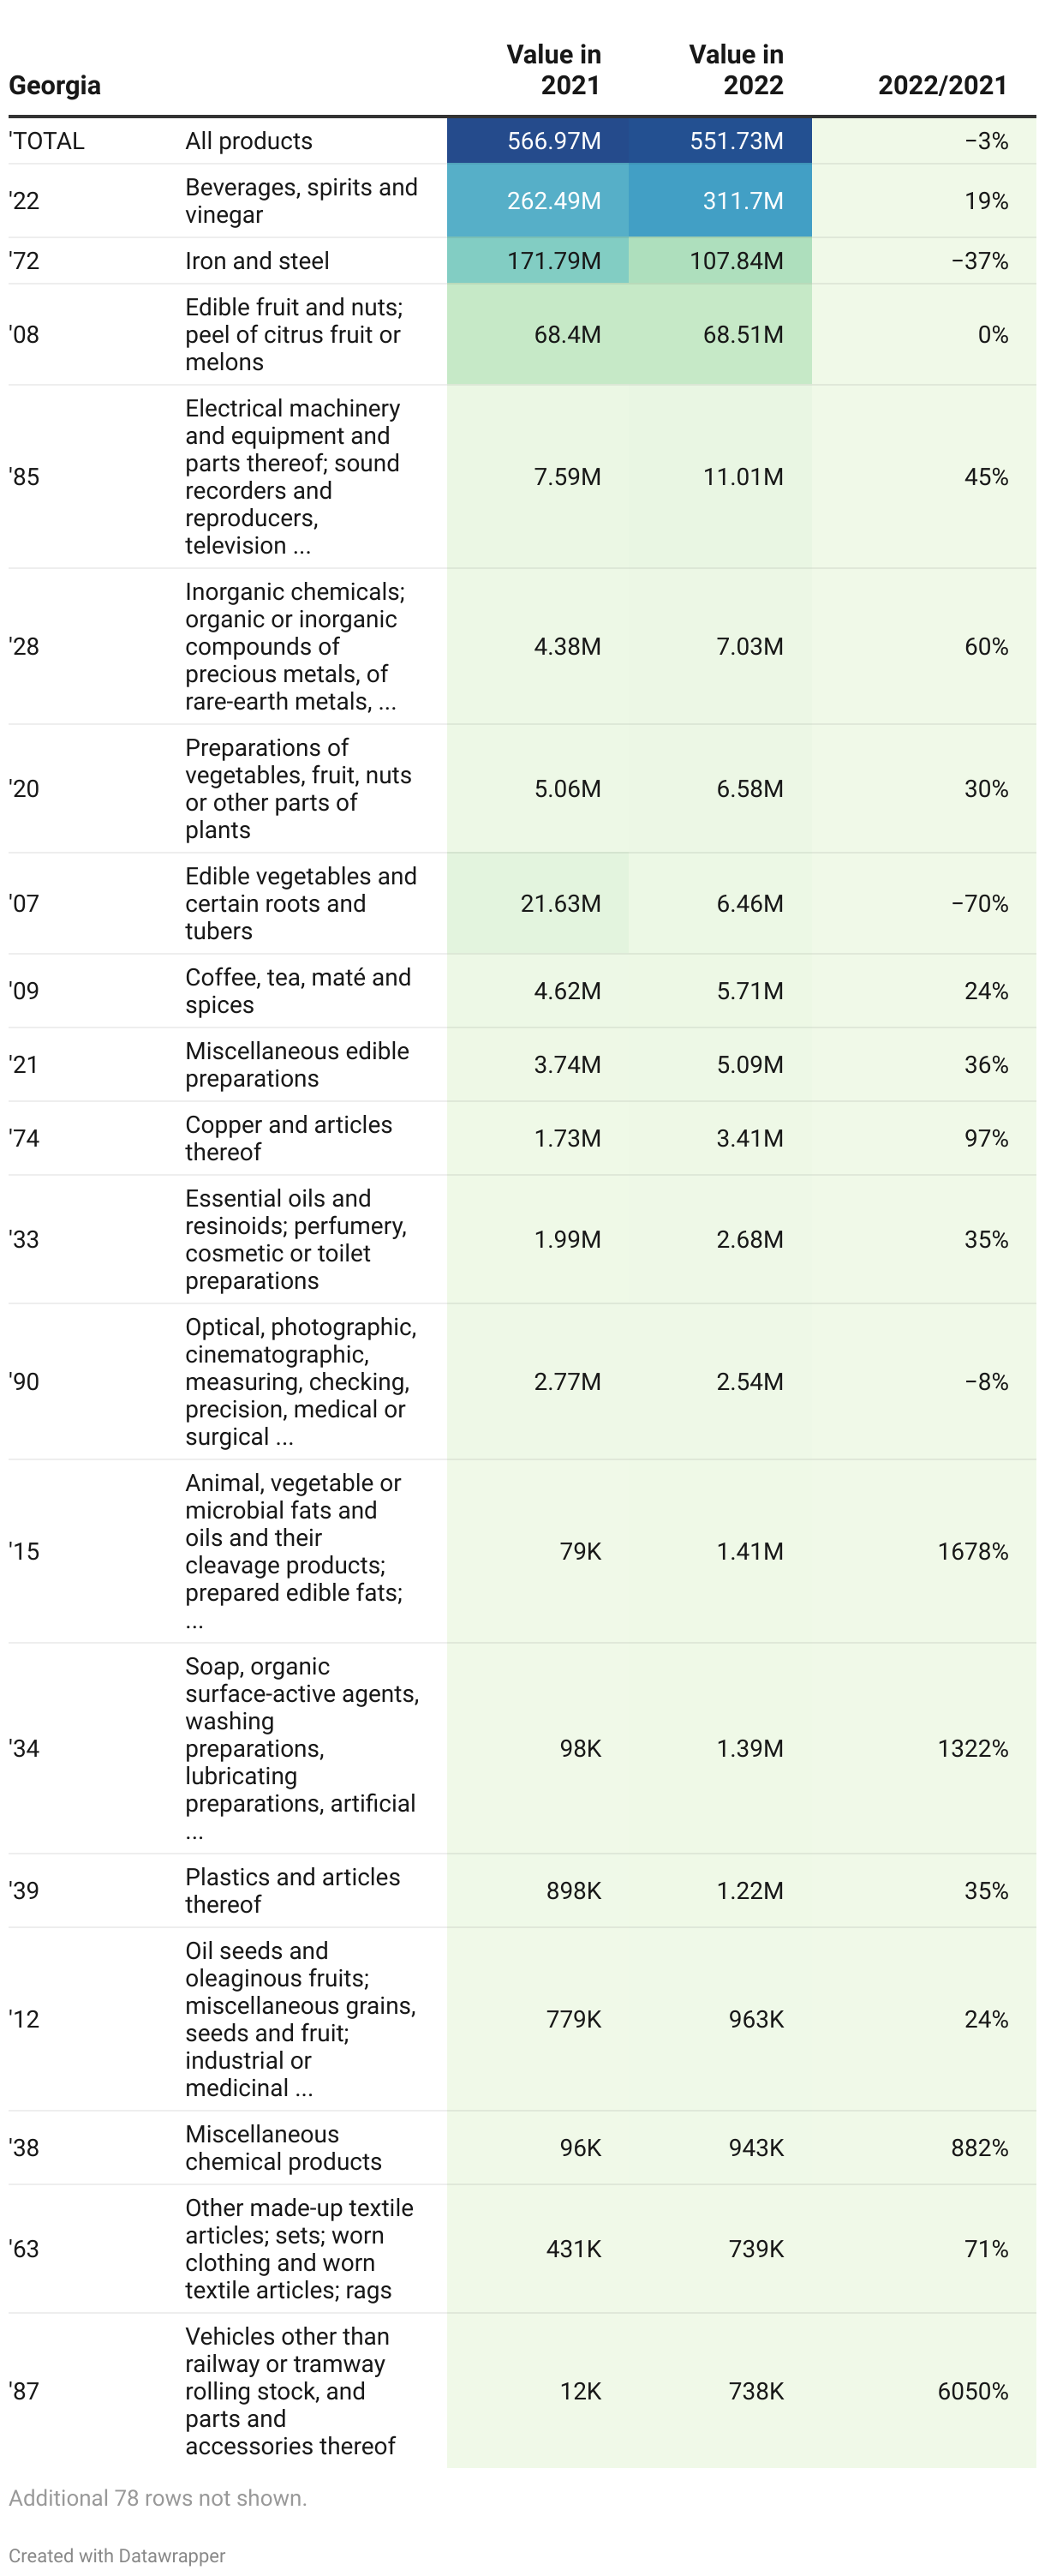
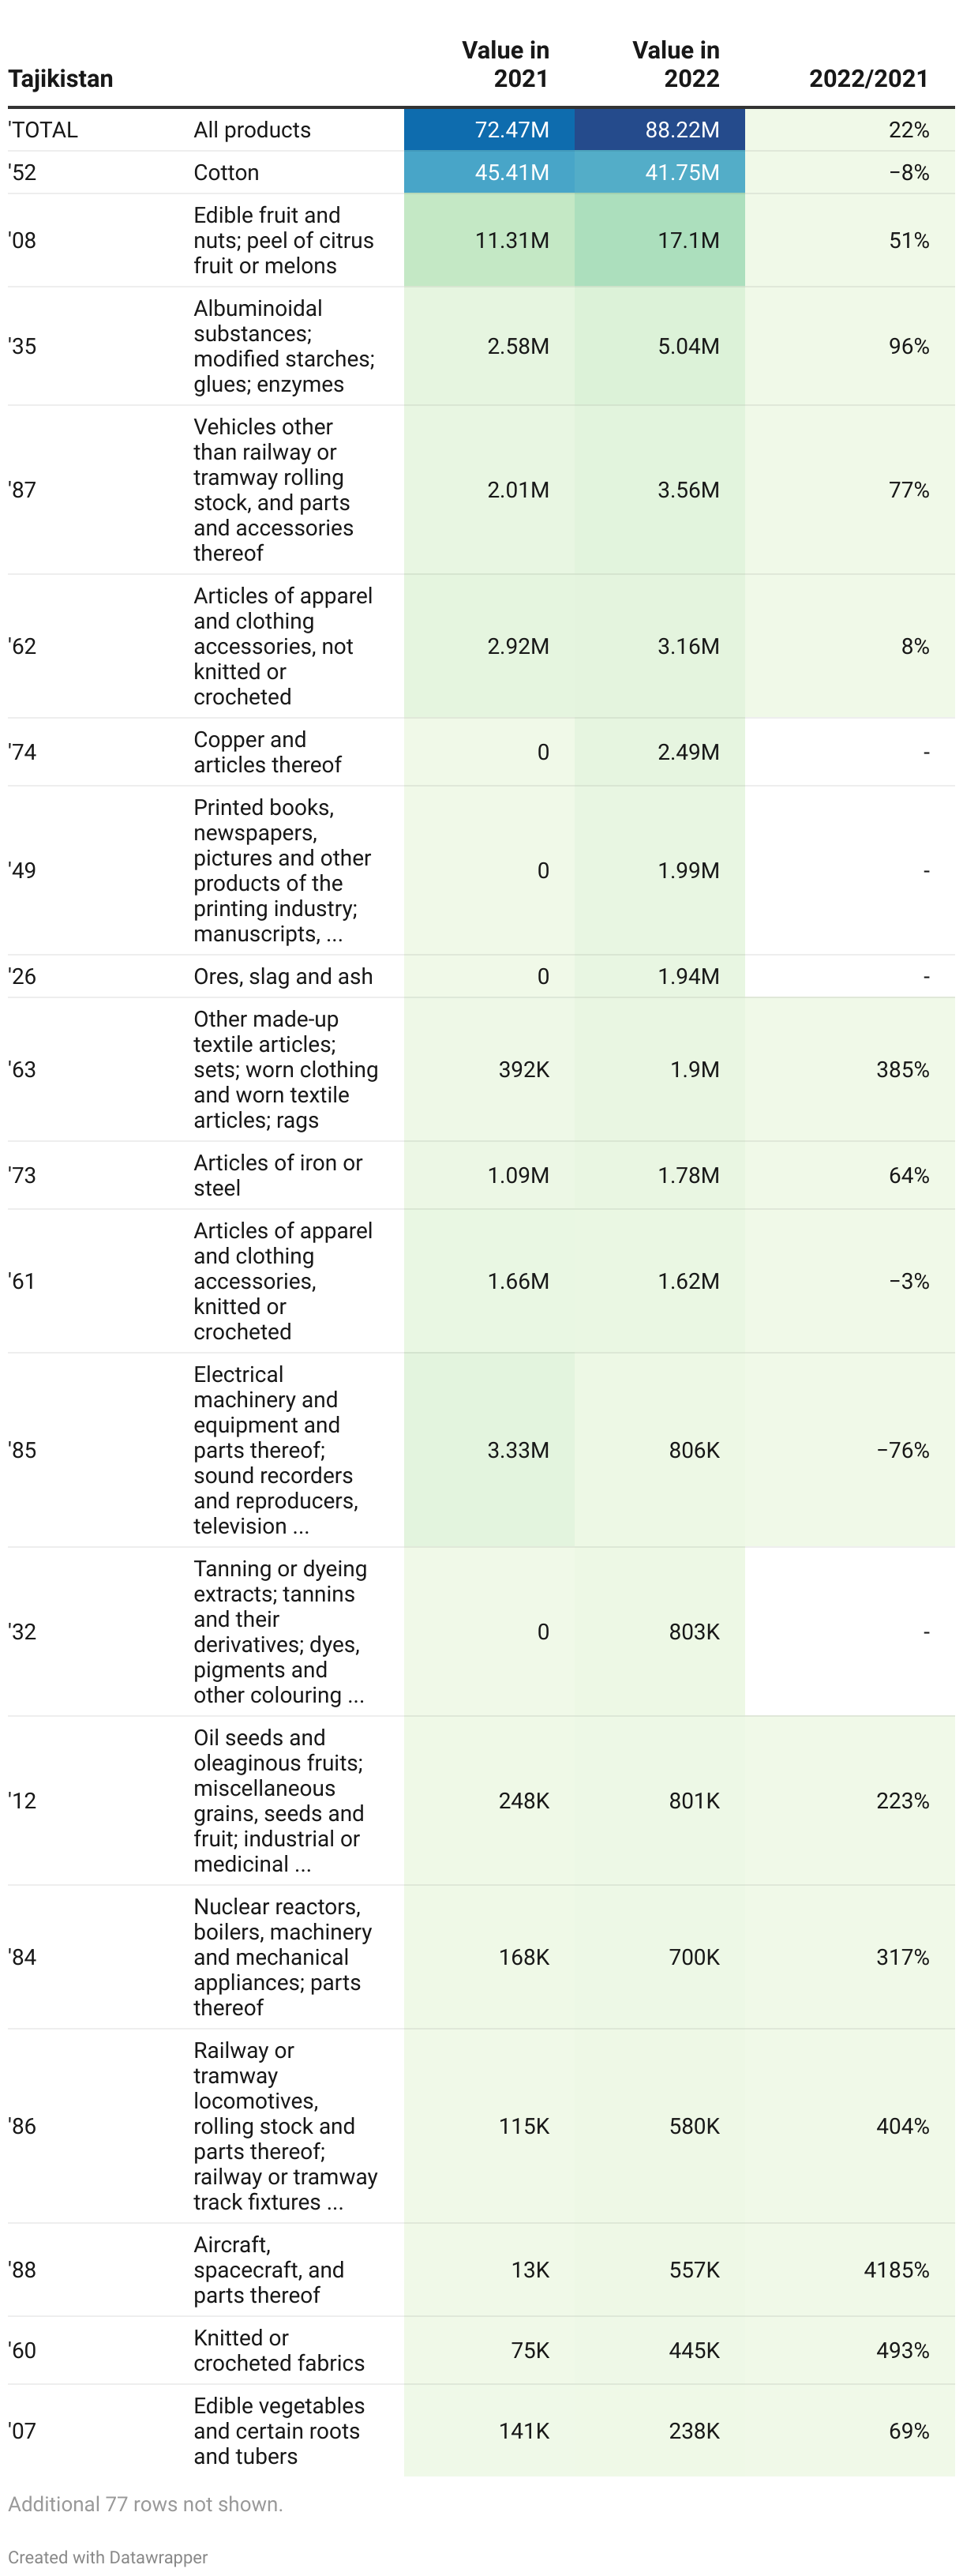
Table 7. Export of goods from Tajikistan to Russia in 2021-2022, $

Attention
The author doesn`t work for, consult to, own shares in or receive funding from any company or organization that would benefit from this article, and have no relevant affiliations