Historically, press coverage of asset purchase programs, including quantitative easing, has largely been relegated to the developed world specifically focusing on a few central banks, namely the U.S. Federal Reserve, Bank of Japan, Bank of England, and the European Central Bank among all. However, central banks have performed QE-like policies in countries at various levels of economic development over the last century. How have emerging and developing economies responded to domestic quantitative easing-like policies over the last 50 years and do they show promising results?
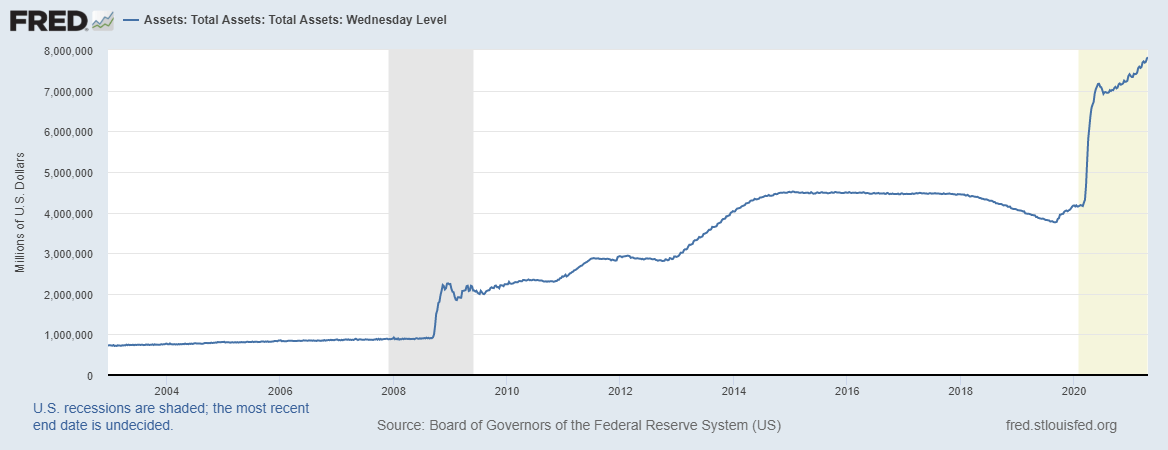
Before the COVID-19 pandemic, in September 2019, the U.S. Federal Reserve began conducting its fourth round of QE since the Global Financial Crisis of 2008. On March 15, 2020, the Federal Reserve announced over $700 billion in new quantitative easing via asset purchases to maintain liquidity in response to the COVID-19 pandemic. As of May 2021, this resulted in over $8 trillion in assets on the books of the Federal Reserve (Figure 1).
Figure 1. Assets of the Federal reserve
With a new round of quantitative easing being enacted by the world’s preeminent central
banks, now is a crucial time to evaluate the history of central bank asset purchases and examine the effects of QE on the real economy.
Traditionally a central bank achieves its goal of price stability and full employment by adjusting the supply of money, usually through open market operations. That is, under the assumption of sticky prices, the monetary authority can increase the money supply, thus increasing liquidity, and stimulating consumption and investment in the short to medium term. By increasing the supply of money, the monetary authority effectively decreases the opportunity cost of holding cash which shows up as a decrease in the nominal interest rate. Low rates make money cheap and allow companies to easily borrow funds and expand their activities, thus increasing investment and GDP. Low rates also incentivize households to spend money rather than save them thus boosting GDP further.
However, with particularly large recessions central banks can theoretically only cut their rates to zero. Further expansionary policy may require unconventional approaches such as quantitative easing. Quantitative easing is a monetary policy whereby the central bank purchases government bonds, securities, and other financial assets to inject money into the economy. One channel of this expansionary policy is through raising inflation expectations. This also serves a dual purpose of combating deflation. As inflation expectations increase, real rates decrease at a fixed level of nominal interest rates, and the central bank stimulates the economy. By purchasing long term bonds, the central banks also effectively decrease the supply of securities from the market available to everyone else. When supply decreases, the price of long term bonds increases and long term rates decrease. Long term bonds are crucial for investment decisions and lower long term rates can further stimulate the economy through increased investment activity.
The effectiveness of QE can be assessed by answering the following four questions.
- As a result of QE monetary policy shocks, do we see significant increases in inflation?
- Do we see significant increases in employment?
- Do we see significant increases in real GDP growth rates?
- Do we see long-term rates going down?
Evidence of statistically significant increases in inflation along with increases in employment and real GDP growth would suggest that QE transmits effectively into the real economy through the channel of temporarily increased inflation expectations.
I evaluate the historical effectiveness of QE from an international perspective based on central bank asset purchase data between 1970 and 2019. In this instance, QE is defined purely as the change in domestic central bank asset claims on the respective economy. This includes claims on the central government through treasury bill purchases, claims on state and local governments such as municipal bonds purchases, claims on nonfinancial public enterprises, claims on the private sector such as commercial paper lending facilities and direct government purchases of corporate bonds and equity, and claims on financial institutions. Then the sum of these claims for a given year is normalized by each nation’s nominal GDP to provide a proxy for a given country’s central bank asset position with respect to the size of its economy. An increase in the share of these claims with corresponding increases in inflation and the GDP growth rate signify asset purchases stimulating the real economy.
In order to model the effect of QE, a local projection is used to show the impulse response of a 1% increase in the central bank assets as a fraction of nominal GDP. The combined effect of a QE regime can be found by taking the sum of the effects across all years in the graphed response. The data generally supports the theory of stimulatory effects of quantitative easing in various sample categorizations. It should be noted that this model only shows increases in inflation due to QE and not inflation expectations which firms and households use to make decisions.
Figure 2. Impulse responses of inflation to a 1% increase in central bank assets as a share of GDP
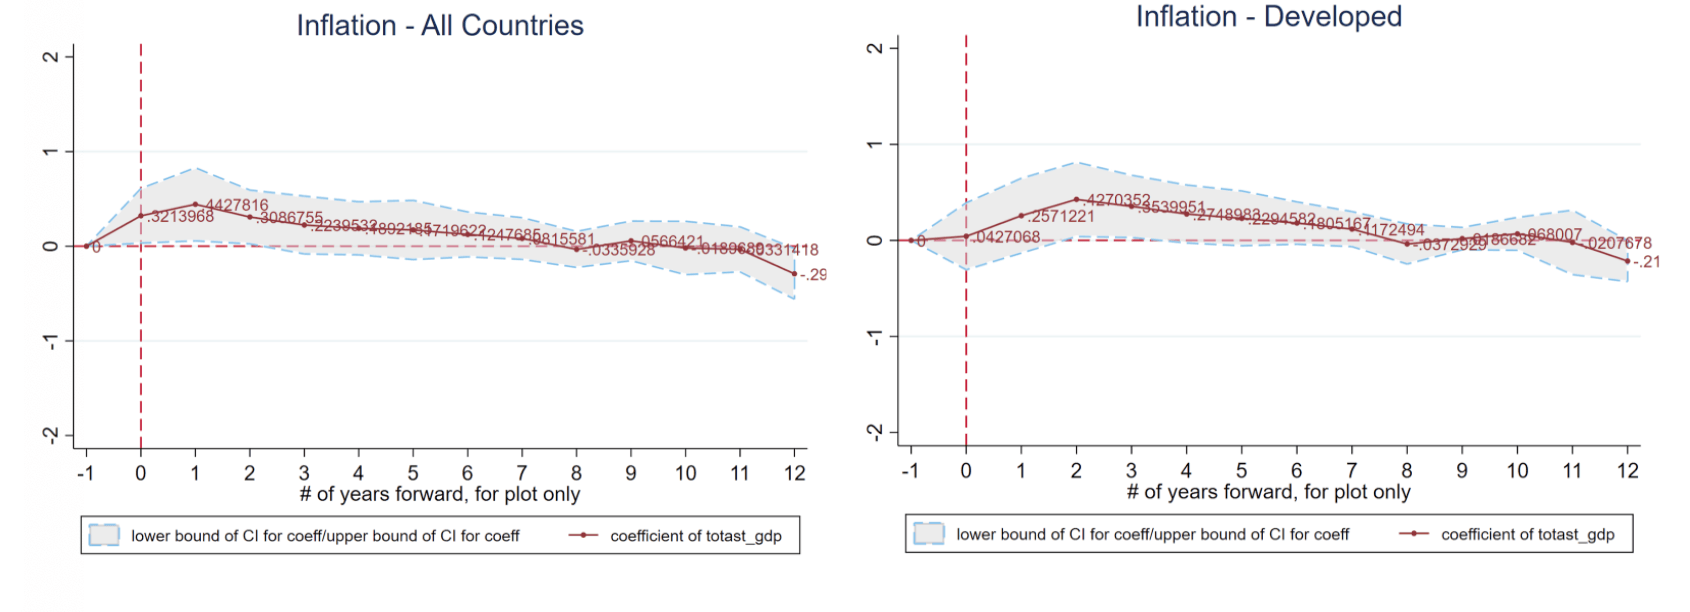
Source: Author’s calculations
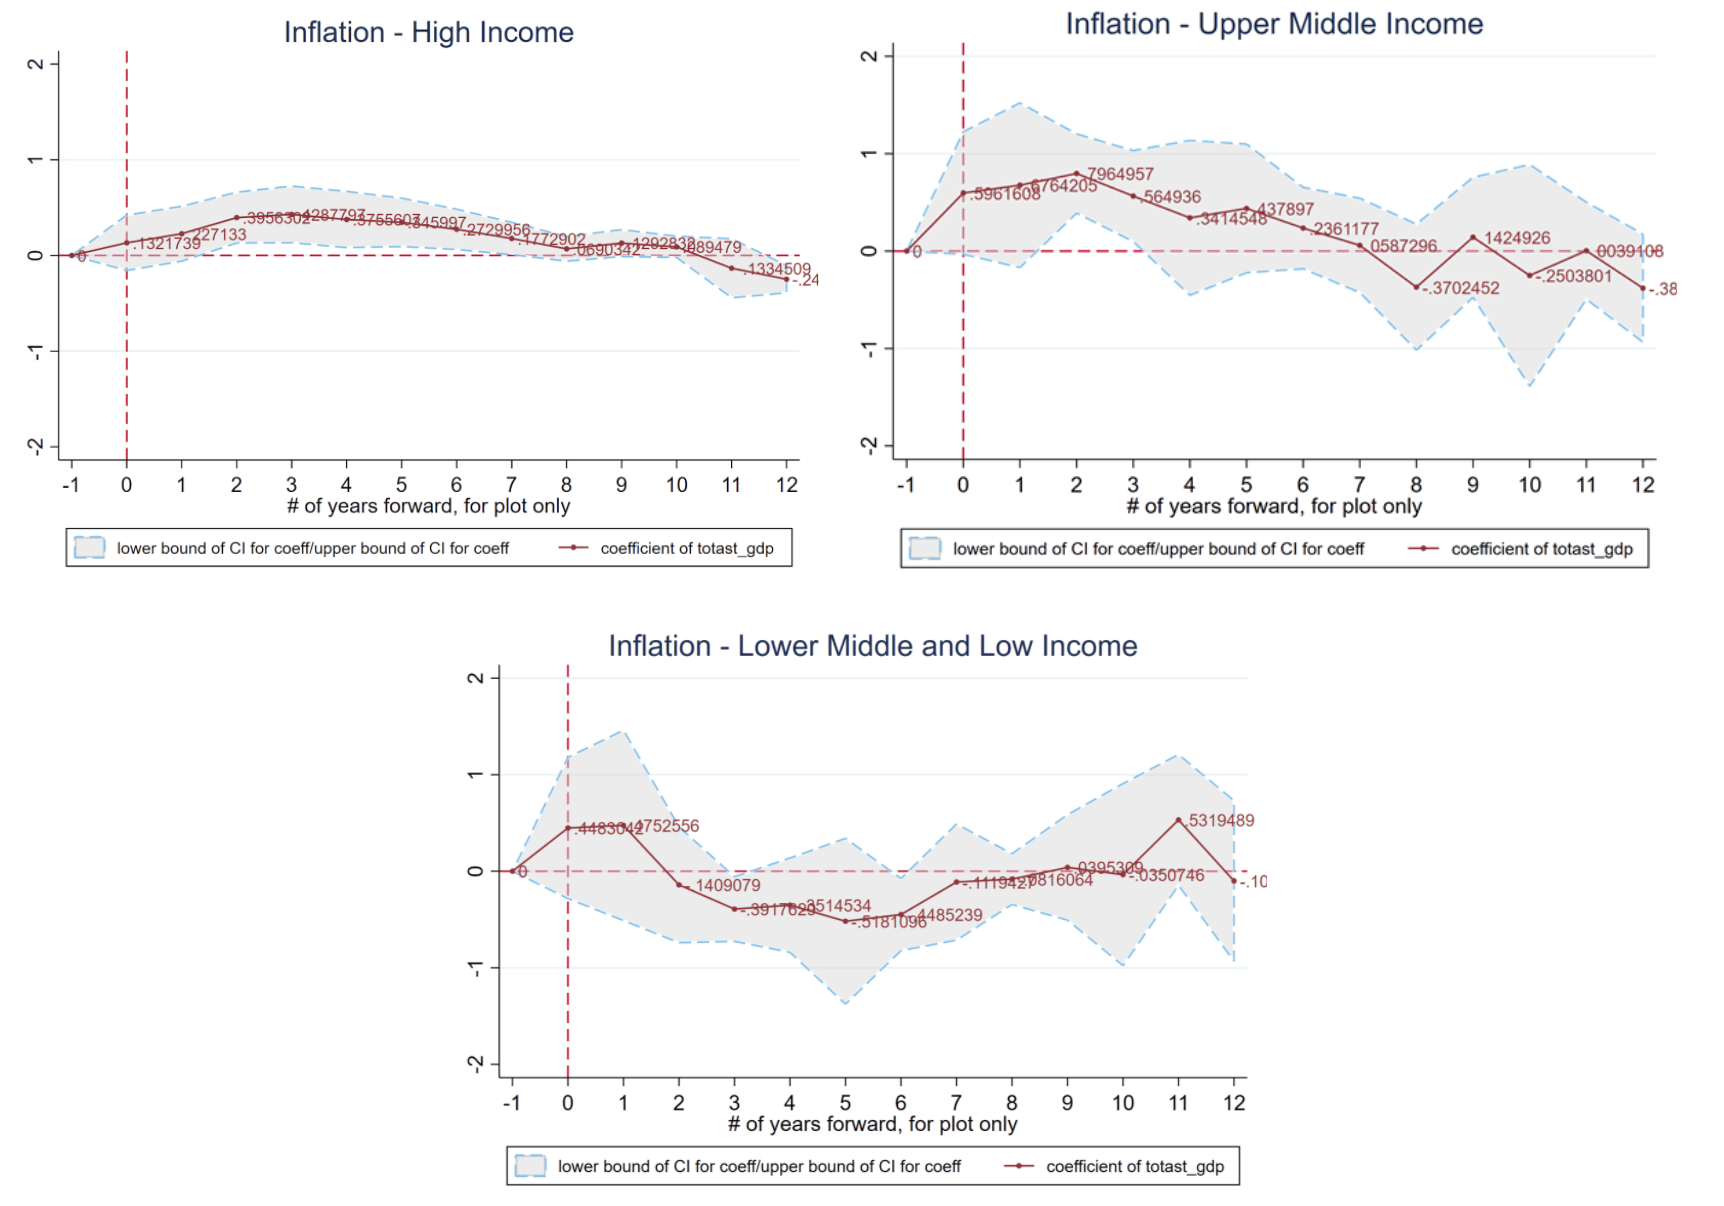
Over the last 50 years, in developed and high-income countries we see robust increases in inflation as a result of a QE regime. This is unsurprising as those countries have the longest records of using asset purchases as stimulatory monetary policy. However, we see an even higher short-run increase in inflation in upper-middle-income countries (Argentina, Armenia, Belarus, Costa Rica, Bulgaria, China, Colombia, Russia, Turkey, Mexico, and South Africa among others), representing just over a third of the world’s population and a fourth of global GDP. A plausible explanation for why inflation responses are in fact greater in upper middle income countries is due to less anchored inflation expectations than in advanced economies such as the U.S. The estimates for lower-middle and low income countries are noisier but qualitatively they are similar to the estimates for upper-middle-income countries in the sense that the short-run response of inflation is fairly large. On the other hand, this short-run increase in inflation for low/lower-middle income countries is not very persistent.
Figure 3. Impulse responses of unemployment to a 1% increase in central bank assets as a share of GDP
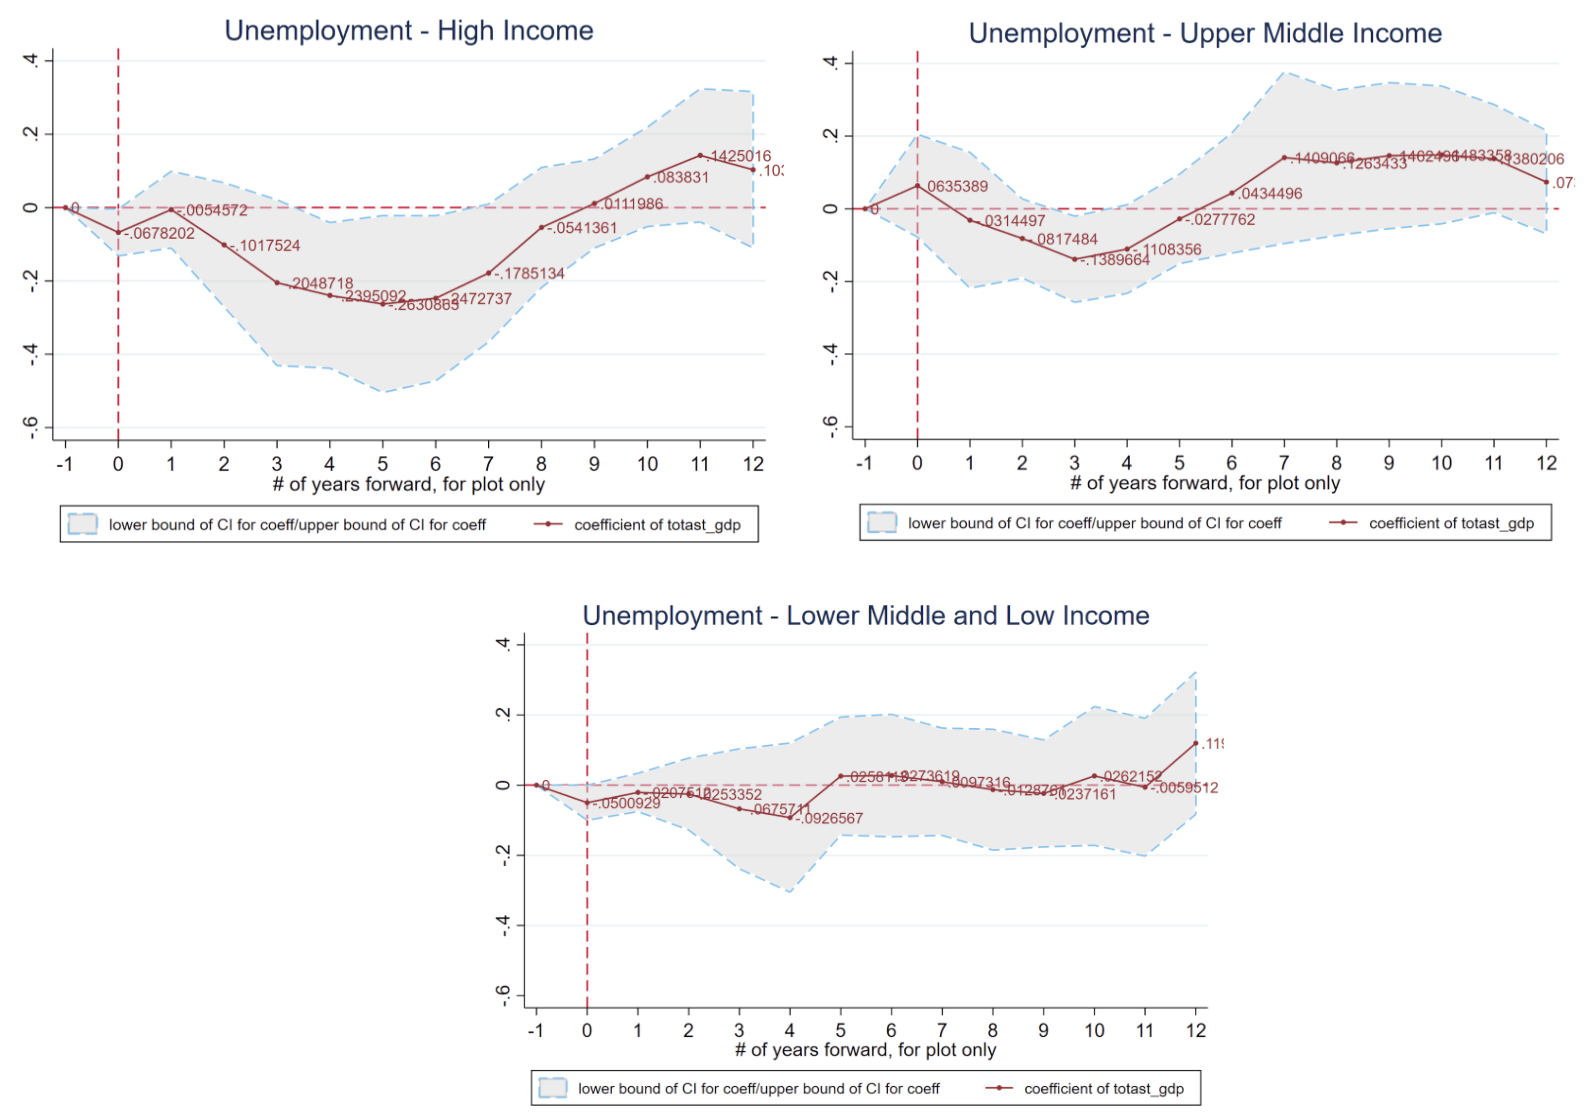
Source: Author’s calculations
As is the case with inflation, it is not surprising that QE in high-income countries decreases the unemployment rate, easing the real effects of a recession. Notably, unemployment in upper-middle-income countries also responds similarly to QE. The effect is shallower and shorter than in high-income nations but is nonetheless significant and large. As with inflation, the response of unemployment in lower-middle and low income countries is almost zero.
Figure 4. Impulse responses of GDP growth to a 1% increase in central bank assets as a share of GDP
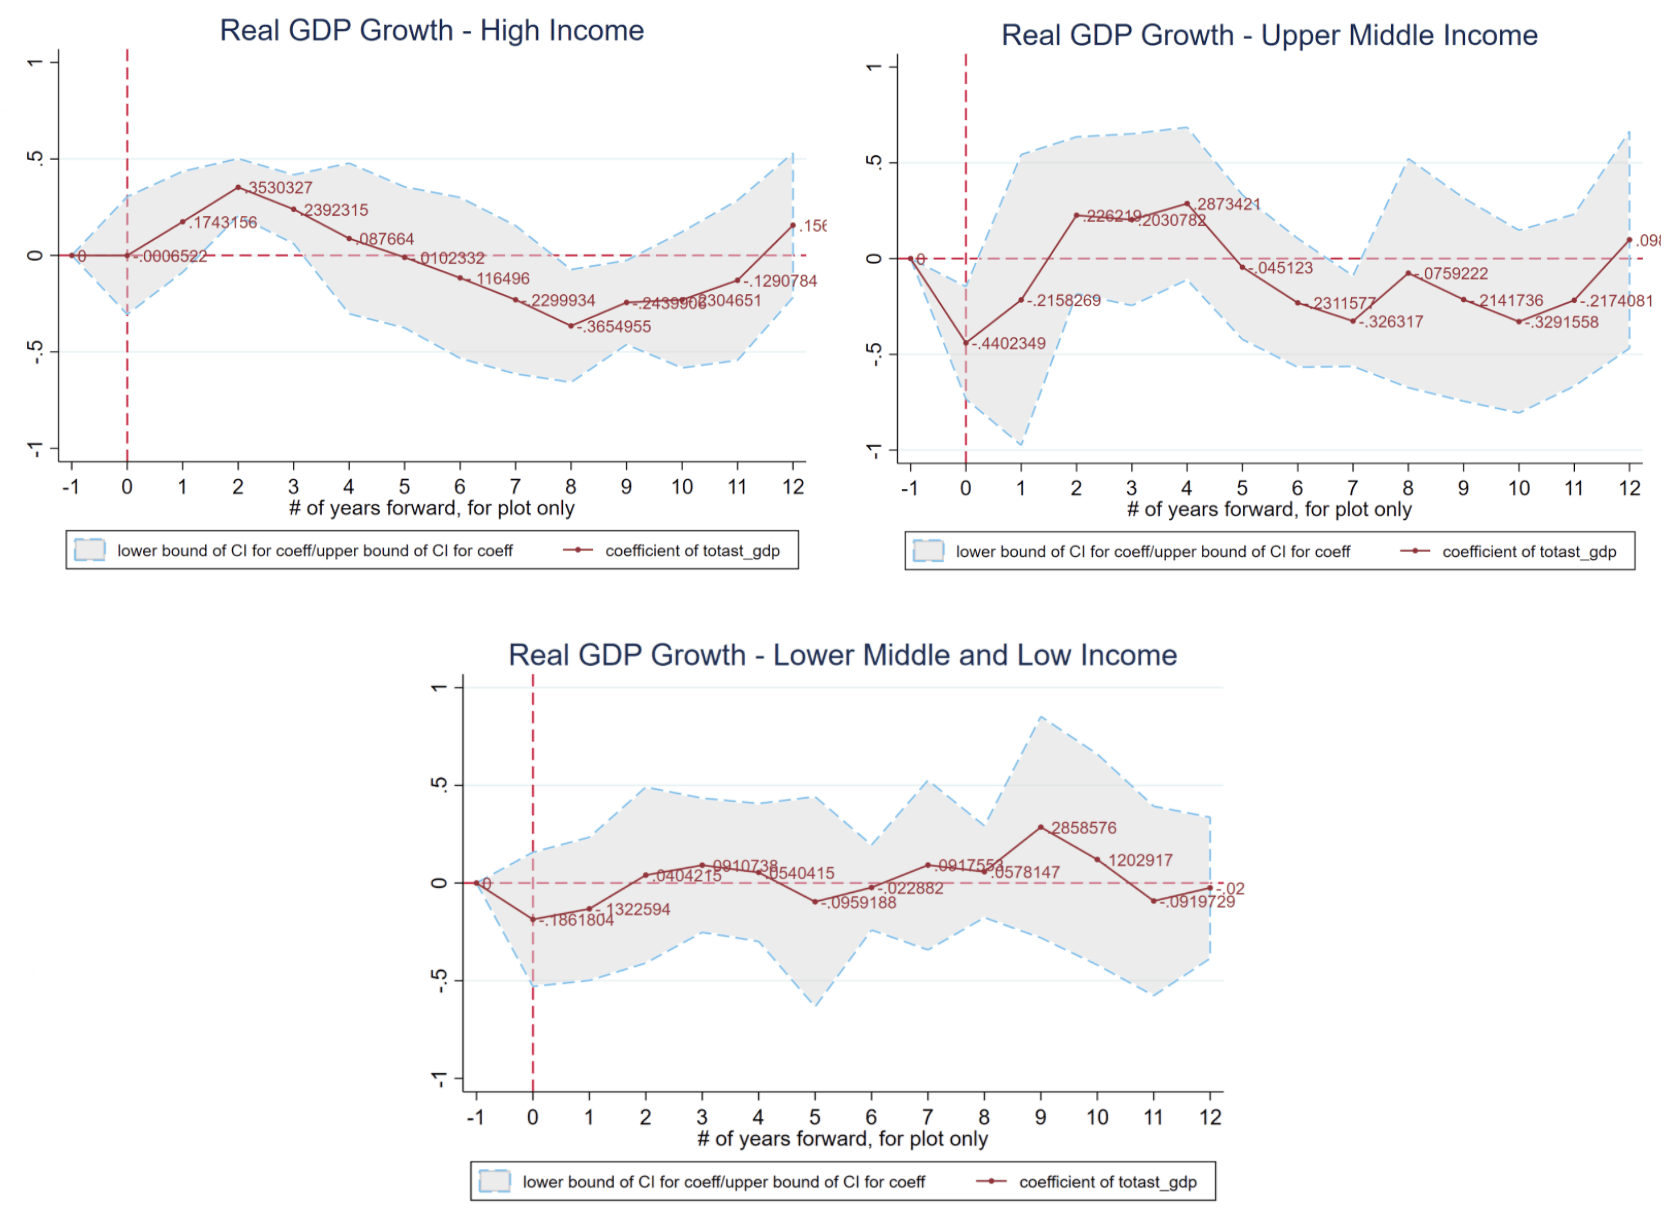
Source: author’s calculations
The GDP response to QE is not as strong in upper-middle-income countries for all variables as in high-income countries. For example, high-income nations show a sharp increase in the real GDP growth rate followed by a gradual decrease in the growth rate as the QE shock dissipates. Upper-middle-income countries exhibit a much less effective response in real GDP growth as a result of a QE than through inflation and unemployment. While moving in the predicted direction, growth rates in upper-middle-income countries do not show statistically significant responses to QE nor do they increase to the same level of magnitude as in high income countries. Like for inflation and unemployment, lower middle and low income countries show little if any response in GDP due to QE.
Overall, high-income countries show pronounced responses to QE policy with large elevated realizations of inflation and supporting co-movements of the real GDP growth rate and unemployment. The strong responses of the three indicating variables in high-income countries reflect a richer history of QE policy in developed economies. This is not surprising since several high-income countries such as the United States, Japan, the Eurozone, and the United Kingdom have engaged in QE for at least a decade since the Great Recession and exhibit long patterns of central bank asset purchases before 2008. Wealthier countries also generally have lower levels of inflation from where increasing inflation expectations is more effectively accomplished by QE.
A larger takeaway here is that while shallower and shorter in response, upper-middle-income countries exhibit a similar pattern in response to QE, especially with respect to inflation and unemployment. Thus QE may have some applications in upper-middle-income countries but the empirical evidence is not clear and one may expect limited effectiveness in stimulating the real economy. For low and lower-middle countries, the record is even less convincing: QE can generate inflation but the real effects are close to zero.
So what does this mean for Ukraine?
The economies that succeeded with QE shared a common privilege: low and stable inflation from which expectations can be increased. This is not the case for Ukraine and the outlook for using QE in the Ukrainian context is not rosy. The evidence shows that QE-like policy in lower-middle and low-income countries (the World Bank classifies Ukraine as a lower-middle-income country) has been unable to significantly increase inflation relative to the baseline rate with little to no reaction of unemployment and the real GDP growth rate. One explanation is that raising inflation expectation via QE policies is not productive because economic players in these countries have a stagflationary view of inflation (in other words, more inflation means less output). This is certainly consistent with the survey evidence for Ukraine. Another possibility is that the financial system is too underdeveloped to take advantage of QE policies (Ukraine ranks low in financial development). In other words, the transmission from asset prices to real activity is weak. In summary, by enacting QE in Ukraine, the National Bank of Ukraine risks inflating away any gains that it has achieved in its 2015-2019 disinflation campaign with little gain in GDP or employment.
Attention
The author doesn`t work for, consult to, own shares in or receive funding from any company or organization that would benefit from this article, and have no relevant affiliations