At the time of writing this article, thirty months have passed since the beginning of Russia’s full-scale invasion of Ukraine, and the resilience of the Ukrainian state and society is still perceived by politicians, experts, and the public worldwide as something self-evident, often synonymous with abstract concepts like “invincibility” or “strength”.
Moreover, societal resilience is frequently viewed as a given and a constant factor that remains in Ukraine and does not require measurement or policies to strengthen it. This perception is incorrect and can lead to problems, as a resilient society at the start of the full-scale invasion is not the same as one that has endured nearly three years of continuous shocks. Furthermore, not all hromadas (territorial community) were fully prepared for the shocks of war at the outset of the invasion, yet they managed to respond and adapt successfully.
This article demonstrates that resilience has specific components that can influence society’s future response to shocks. We also initiating a discussion on the need to develop a methodology for measuring resilience based on surveys of residents in hromadas.
Based on a survey of 2,662 respondents from 12 hromadas across seven regions, we identified which social groups have a lower resilience score, which components of societal resilience are the most problematic, and what factors could affect respondents’ trust in local authorities, one of the most crucial components of successful war shock response.
The survey is representative of these hromadas, using a multi-stage sampling method with quota selection at the final stage. A description of the sample can be found in Appendix 1. The study was conducted as part of the project “Enhancing Hromada Capacity for Reconstruction through Piloting Their Interaction with Universities, “implemented by the Alliance of Ukrainian Universities with the support of the International Renaissance Foundation. Within the survey framework, each university researched one hromada using a unified methodology and questionnaire. The full report on the results of this study is available at the link.
Resilience of Hromadas in the Context of War
In 2014, as part of Ukraine’s European integration, the government and Parliament launched the decentralization reform. Changes in legislation and operational practices enabled local authorities to independently manage budgets, retaining 60% of personal income tax (PIT), and engage in more active local policymaking. These steps stimulated the development of hromadas, made them more independent from the state, and increased Ukrainians’ interest in local affairs. A significant outcome of decentralization is the growing trust in local authorities, which remains higher than in most state institutions (Arends et al., 2023). This autonomy and trust allowed local authorities to make swift decisions in crisis situations, a capability that proved crucial in early 2022.
After the full-scale invasion, the concept of resilience gained significant traction. However, after nearly thirty months of large-scale war, the resilience of the Ukrainian state and society is often perceived by politicians, experts, and the public worldwide as a given. Ukraine’s demonstrated resilience is frequently described as “invincibility ” (Mathers, 2023) and is attributed simultaneously to institutions, the Armed Forces, and society.
At the same time, few studies on resilience specifically focus on hromadas. The resilience of hromadas is a complex phenomenon influenced by financial and political decisions, making its precise measurement both practically and theoretically significant. On the one hand, we need to understand which decisions and policies enhance resilience to the shocks of war in order to scale them up. On the other hand, studying interstate war offers a unique opportunity to strengthen or reassess existing theories.
One important tool for measuring resilience is the Index of Perceived Community Resilience (IPCR; Kulig, Edge, and Joyce 2008), developed based on the Community Resilience Scale created by Brown and Kulig (1966/7). It allows for a more precise and focused measurement of perceived hromada resilience and incorporates expert feedback while maintaining the integrity of the resilience concept. The IPCR tool includes 11 statements, and respondents rated their agreement with the statements on a scale from 0 — “Strongly Disagree” to 4 — “Strongly Agree.” The three dimensions of the scale and their respective items are described in Table 1.
Table 1. Components of the Community Resilience Perception Scale (Kulig 2013).
| Component / Subscale | Statement |
| Leadership
(0=Strongly disagree, 4=Strongly agree) |
My hromada has strong leadership |
| The leaders of my hromada listen to the residents | |
| Changes in my hromada are positive | |
| When a problem arises, hromada residents are able to solve it | |
| Hromada involvement
(0=Strongly disagree, 4=Strongly agree) |
Residents of my hromada have a sense of pride in it |
| Residents of my hromada share similar values or ideas | |
| Residents of my hromada are open to new ideas | |
| Residents of my hromada help each other | |
| Residents of my hromada participate in hromada events | |
| Isolation and negative environmental impact
(0=Strongly disagree, 4=Strongly agree) |
The physical environment in my hromada negatively affects my health |
| Residents of my locality feel isolated from the rest of the hromada | |
| Residents of my hromada feel isolated from the rest of the region |
NB: Please note that this table and Figure 1 contain negative statements in the section “Isolation and Negative Environmental Impact.” Therefore, the fewer people who agree with these statements, the better the situation in the hromada.
In this article, we rely on research data and analysis conducted by the team from the Center for Sociological Research, Decentralization, and Regional Development at the KSE Institute (Karakai D. et al., 2024).
We will first examine the results of the hromadas’ assessments using the Perceived Resilience Scale, followed by an analysis of trust in local authorities and the factors that influence it.
Perceived Resilience Scale
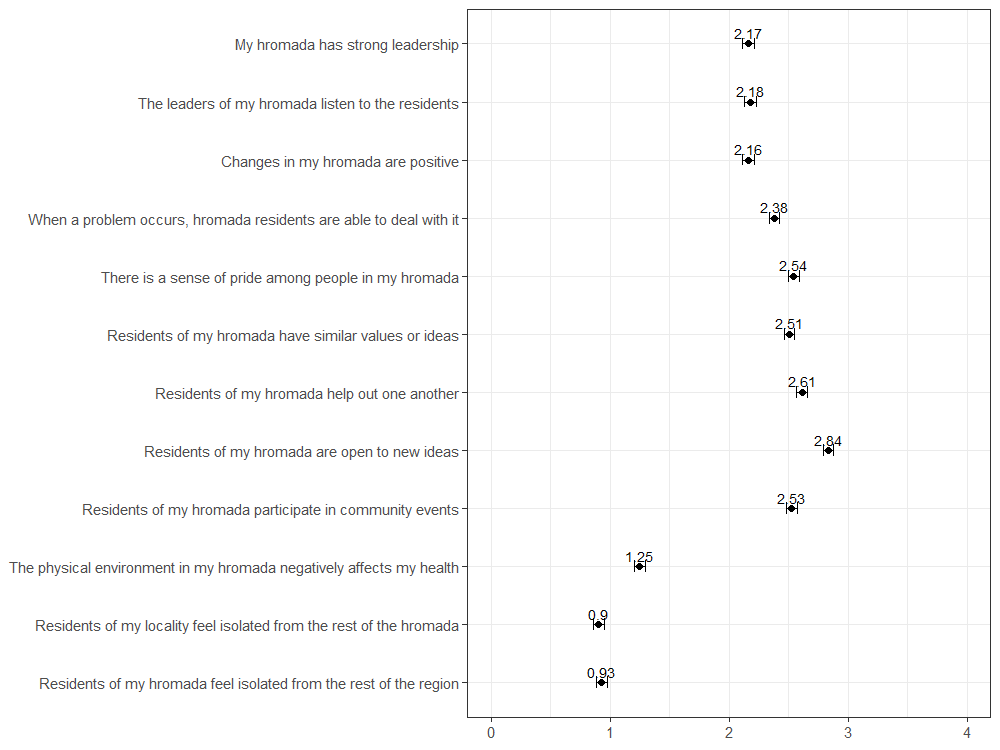
Figure 1 shows the average responses of respondents on this scale. Respondents were quite skeptical in their assessments of the hromada leadership (2.16 out of 4), its willingness to listen to residents (2.17), and changes within the hromada (2.16).
At the same time, the assessment of hromada cohesion was quite positive: respondents generally believe that residents are capable of solving problems (2.38), share common values (2.50), take pride in their hromada (2.53), and actively participate in joint activities (2.53). The openness of hromada residents to new ideas was rated particularly high (2.83).
Meanwhile, respondents mostly disagree that their physical environment negatively affects their health (1.26) or that they feel isolated from the rest of the hromada or region (0.91 and 0.94).
Thus, respondents tend to hold a skeptical view of the hromada leadership, a positive view of its residents, and an overall positive view of the physical environment and the lack of isolation within their hromada.
Figure 1. Average Values of Indicators from the Perceived Community Resilience Scale (where 0 = Strongly Disagree, 4 = Strongly Agree)
We created a composite scale by summing the values of these 12 statements (Cronbach’s alpha = 0.85). The scale ranges from 0 to 48, where higher scores correspond to a higher level of resilience. For statements belonging to the subscale “Isolation and Negative Environmental Impact,” we reversed the scale direction. This means that the more a respondent disagrees with a statement, the higher the score on the scale. Meanwhile, in Figure 1, the responses are marked according to the “direct” scale, and disagreement with a negative statement should be interpreted as a positive sign.
The analysis showed statistically significant differences in the Perceived Resilience Scale between hromadas in combat zones (30.9) and non-frontline hromadas (30.1), as well as between men (29.8) and women (30.7). This indicates that residents who perceive their hromadas as frontline and women rate their hromada’s resilience higher.
No statistically significant differences were found based on age or income level. However, respondents with basic (31.3) and complete higher education (30.9) have higher average resilience scores than those with incomplete higher (29.0) or vocational education (28.9). Additionally, IDPs have higher resilience scores (32.1) than non-IDPs (30.1). No statistically significant differences were found for those with active military members or veterans in their families.
Figure 2. Average Values of the Perceived Community Resilience Scale by Hromada Type and Demographic Characteristics
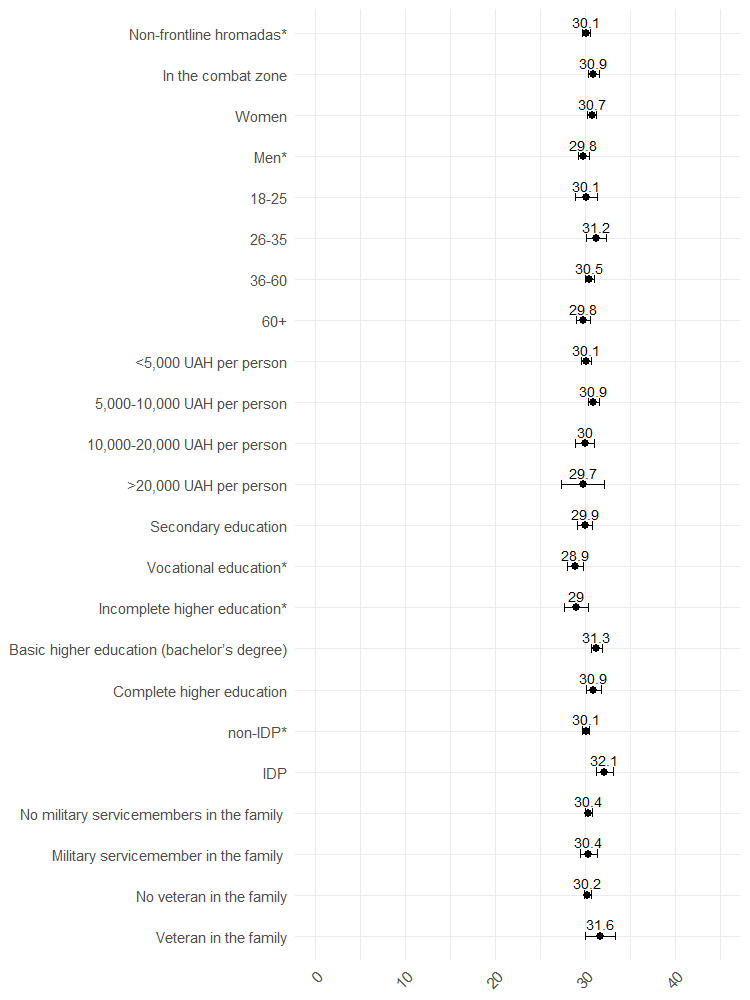
* Groups with a statistically significant (p < 0.05) lower score on the Perceived Community Resilience Scale compared to others. Data for the figure are provided in Table 2 in the Appendix. The number on the chart indicates the average value, and the line represents the 95% confidence interval.
What Influences Trust in Local Authorities?
Trust in local authorities is a key factor determining hromadas’ stability and development, especially in times of war. In this study, we operationalize trust in local authorities as the approval of local authorities’ actions due to the absence of a direct question about trust in the survey. We acknowledge that support for and trust in local authorities are distinct concepts. However, given the conceptual proximity between trust and support, we consider this approach appropriate for our analysis.
We aim to identify the factors that most influenced the level of approval of local authorities’ work (or trust in them) in 2023. The level of approval was measured using a survey with a 4-point scale ranging from 0 (“Completely Disapprove”) to 3 (“Completely Approve”).
Like any social dimension, trust in local authorities can depend on many factors. The most obvious and well-documented in the scientific literature is the dependence of trust on the quality of service delivery (Van de Walle and Bouckaert 2003), accountability and opportunities for participation (Jennings, 1998), ideological and political characteristics of the authorities (Christensen et al., 2020), and the demographic structure of the hromada’s population (Christensen and Lægreid 2009). We examined how these factors and the hromada’s score on the Perceived Resilience Scale affect our respondents’ trust in local authorities.
Our study shows that a higher perception of hromada resilience increases approval of the performance of the mayor and city council, even after accounting for variables such as the hromada’s location in a combat zone, respondents’ gender, age, income, and education, as well as evaluations of government actions, such as the effectiveness of local authorities’ crisis response and satisfaction with public services.
The effectiveness of local authorities’ response was measured by residents’ satisfaction with the authorities’ handling of emergencies caused by the war (interruptions in heat, electricity, and water supply, as well as the elimination of shelling consequences) and the effectiveness of informing residents about potential threats and ways to respond to them. Based on responses to seven questions, we created a scale ranging from 1 to 5, where 1 means “very satisfied” with the authorities’ response, and 5 means “not satisfied at all” (Cronbach’s alpha = 0.89).
Satisfaction with public services was calculated by averaging the ratings of 17 services and sectors on a scale from 1 to 5, where 1 is “Terrible,” and 5 is “Excellent” (Cronbach’s alpha = 0.89). The list of services includes sewage, water supply, heat supply, energy efficiency and independence, hromada beautification, healthcare, general secondary education, preschool education, public transport, road infrastructure, economic development, sports, culture, waste removal, ecology and environment, inclusiveness and accessibility of public spaces and social infrastructure, support for IDPs, service members and their families, and other vulnerable groups (including youth, older adults, and people with disabilities).
Moreover, the impact of the hromada resilience rating (Figures 3 and 4) even surpasses the effect of the local authorities’ ability to respond to crises and the level of satisfaction with public services. If we remove the statements “My hromada has strong leadership” and “The leaders of my hromada listen to residents” from the scale (statements that relate to approval of specific aspects of local authorities’ work), the significant effect still remains. However, it then becomes comparable to the effect of the authorities’ crisis response capability and the level of satisfaction with services.
Figure 3. Standardized Coefficients of Linear Regression for Approval of the Mayor’s Performance
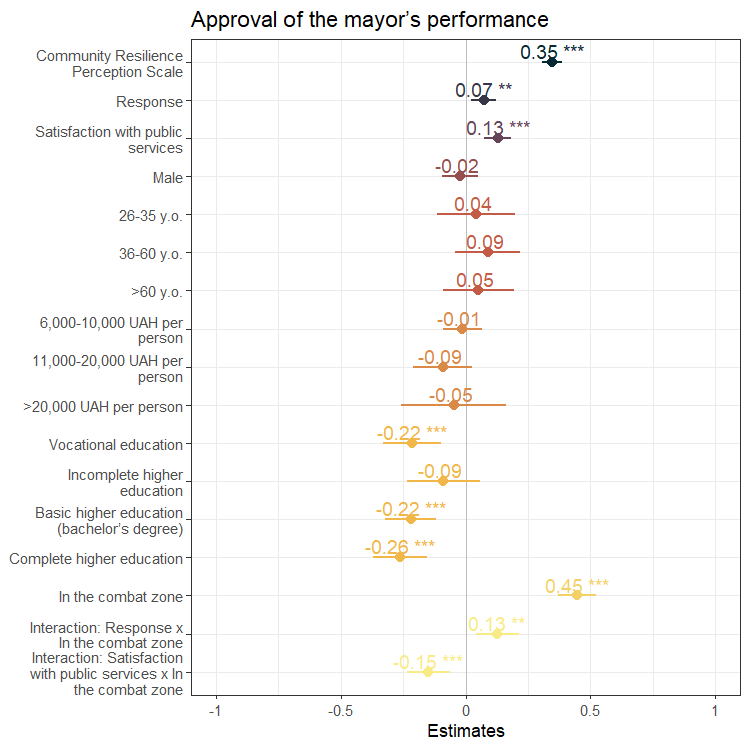
Figure 4. Standardized Coefficients of Linear Regression for Approval of the City Council’s Performance
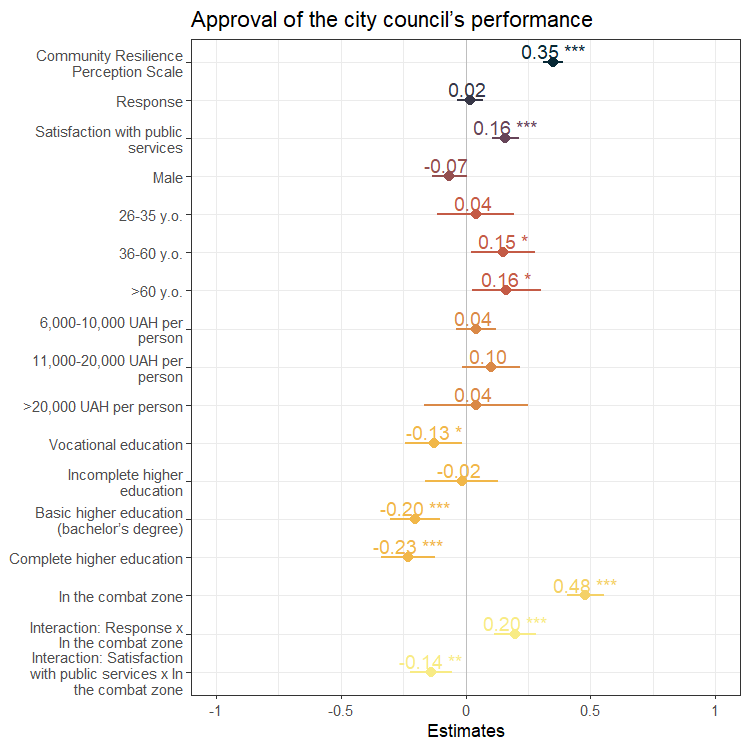
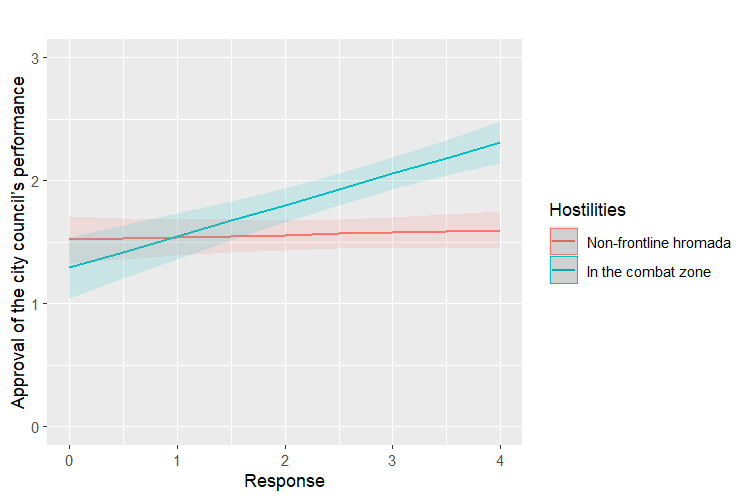
An interesting interaction between being in a combat zone and the level of trust in local authorities was observed. In frontline hromadas, the mayor’s approval is, on average, 0.52 points higher, and the city council’s approval is 0.24 points higher than in non-frontline hromadas (controlling for other variables). Since this perception is based on the respondent’s view of whether their hromada is in a combat zone, this may indicate that the sense of threat mobilizes residents and creates a feeling of greater solidarity with local authorities. At the same time, the effectiveness of local authorities’ crisis response has a greater impact on their support in combat zone hromadas. For non-frontline hromadas, this indicator does not have a significant effect on support for the city council (Figures 5 and 6).
Figure 5. Predicted Values of Mayor’s Performance Approval Based on the Effectiveness of Local Authorities’ Response from a Linear Regression
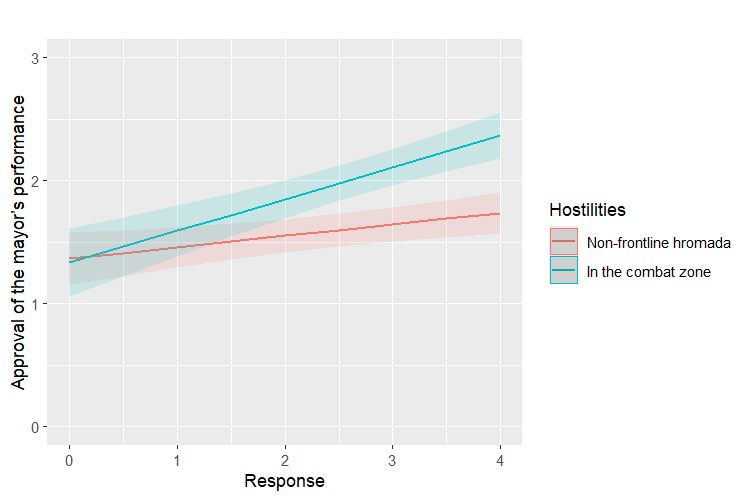
Figure 6. Predicted Values of City Council’s Performance Approval Based on the Effectiveness of Local Authorities’ Response from a Linear Regression
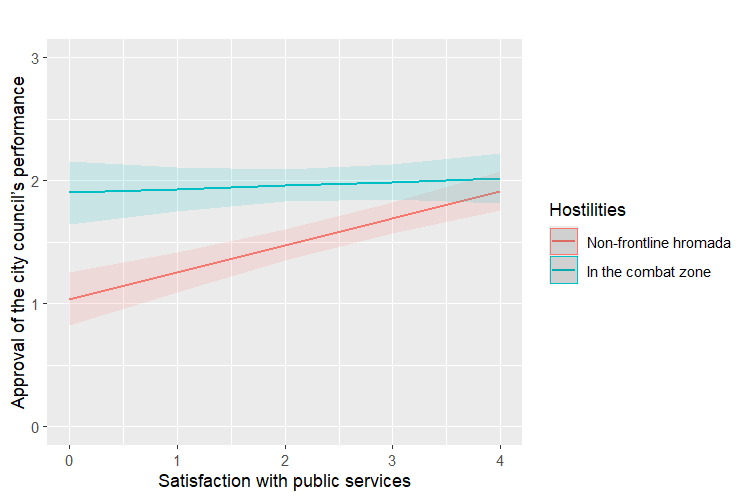
A similar pattern is observed in the impact of satisfaction with public services: the quality of services provided by local authorities affects trust in them (support for the mayor and city council) exclusively in non-frontline hromadas (see Figures 7 and 8).
Among socio-demographic factors, respondents’ education level plays an important role: respondents with secondary education rate the activities of local authorities more positively compared to those with vocational, basic, or higher education. Additionally, respondents over 36 were more likely to approve of the city council’s work than young people aged 18-25.
Figure 7. Predicted Values of Mayor’s Performance Approval Based on Satisfaction with Public Services from a Linear Regression
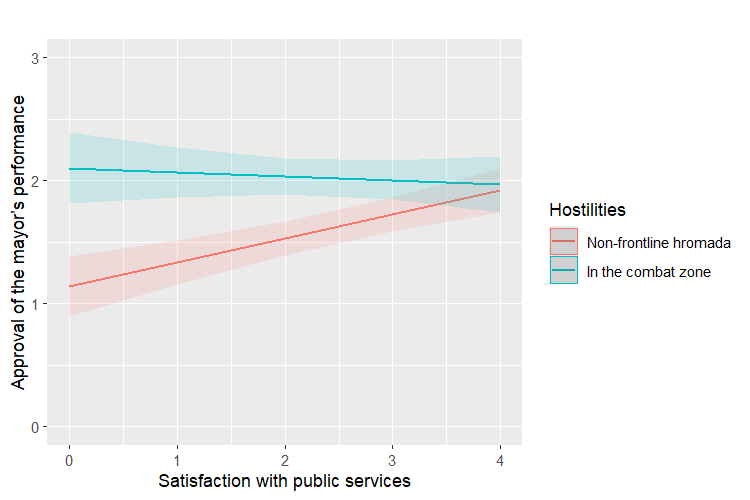
Figure 8. Predicted Values of City Council’s Performance Approval Based on Satisfaction with Public Services from a Linear Regression
Summary and Conclusion
Our study shows that hromada resilience can be measured using the Index of Perceived Resilience as well as other approaches.
Importantly, resilience can and should be systematically measured and monitored over time, identifying problematic aspects both in specific hromadas and in society as a whole. This approach allows hromadas to be better prepared for war-related shocks and crises, something we have not seen in many hromadas in Ukraine, which have already responded and skillfully adapted to these shocks during the war.
Based on the responses of 2,662 respondents, we found that citizens rated components of resilience, such as the quality of hromada leadership and the willingness of local authorities to listen to residents, as the lowest. In contrast, assessments of residents’ readiness to participate in hromada life were significantly higher. Therefore, it is necessary to enhance communication between hromada leadership and its residents and increase transparency and citizen participation in decision-making processes.
Our study also shows that trust in local authorities is closely linked to the perception of hromada resilience and depends on the effectiveness of crisis response and the quality of public services provided. Furthermore, the impact of public service quality on trust in authorities is more pronounced in non-frontline hromadas, while in combat zones, the ability of authorities to respond promptly to challenges is more critical. Interestingly, respondents who perceive their hromada as a combat zone are more likely to see it as resilient. This may indicate that in the face of danger, Ukrainians do not lose determination but rather unite.
The identified differences between frontline and non-frontline hromadas, as well as between various socio-demographic groups, highlight the need to consider these factors when shaping policies. Therefore, in frontline hromadas, resources should primarily be directed toward enhancing the local authorities’ capacity to respond to crises. In non-frontline hromadas, it is essential to ensure the provision of quality public services, as their absence undermines trust in authorities and makes hromadas more vulnerable.
Appendix 1. Sample Description
Table 1.1. Territorial Distribution
| Amalgamated Territorial Hromada (Hromada) | Region | Number of Respondents |
| Mena | Chernihiv | 250 |
| Marhanets | Dnipropetrovsk | 220 |
| Zelenodolsk | Dnipropetrovsk | 200 |
| Myrove | Dnipropetrovsk | 208 |
| Lozova | Kharkiv | 206 |
| Varash | Rivne | 241 |
| Romny | Sumy | 246 |
| Shostka | Sumy | 201 |
| Sumy | Sumy | 290 |
| Chervonohrad | Lviv | 200 |
| Berezne | Rivne | 200 |
| Verkhovyna | Ivano-Frankivsk | 200 |
Of the respondents, 1,504 (57.4%) were women. Additionally, 342 respondents (10.5%) are IDPs, 442 (13.6%) have a family member in the military, and 150 (4.6%) have a veteran in the family. The distribution by age and education level is presented in Table 1.2.
Table 1.2. Age and Education of Respondents
| Age | Number of Respondents | Education | Number of Respondents |
| 18-25 | 208 | Complete higher education or a scientific degree | 647 |
| 26-35 | 300 | Basic higher education | 497 |
| 35-60 | 1476 | Incomplete higher education | 195 |
| 60+ | 677 | Vocational education | 800 |
| Complete general secondary education | 415 | ||
| Basic general secondary education | 89 | ||
| Incomplete basic education | 7 |
Table 2. Average Values of the Perceived Hromada Resilience Scale
| Average (Standard Error) | |
| Statistically significant difference between hromadas in the combat zone and those in the non-frontline | |
| In the combat zone | 30.9 (9.3)* |
| Non-frontline hromadas | 30.1 (9.2) |
| Statistically significant difference between men and women | |
| Men | 29.8 (9.8)* |
| Women | 30.7 (9.7) |
| No statistically significant differences between age groups | |
| 18-25 | 30.1 (8.9) |
| 26-35 | 31.2 (9.4) |
| 36-60 | 30.5 (9.8) |
| 60+ | 29.8 (10.0) |
| No statistically significant differences between income groups | |
| Up to UAH 5,000 per person | 30.1 (9.9) |
| UAH 5,000-10,000 per person | 30.9 (9.6) |
| UAH 10,000-20,000 per person | 30.0 (9.1) |
| More than UAH 20,000 per person | 29.7 (10.2) |
| Statistically significant difference between respondents with vocational and incomplete higher education and those with basic and complete higher education | |
| Secondary education | 29.9 (9.8) |
| Vocational education | 28.9 (9.9)* |
| Incomplete higher education | 29.0 (9.6)* |
| Basic higher education (bachelor’s degree) | 31.3 (9.1) |
| Complete higher education | 30.9 (10.2) |
| Statistically significant difference between IDPs and non-IDPs | |
| IDP | 32.1 (8.8) |
| Non-IDP | 30.1 (9.8)* |
| No statistically significant differences between groups | |
| Military servicemember in the family | 30.4 (9.8) |
| No military servicemembers in the family | 30.4 (9.6) |
| No statistically significant differences between groups | |
| Veteran in the family | 31.6 (10.6) |
| No veteran in the family | 30.2 (9.7) |
* groups that have lower scores on the community resilience perception scale compared to others
Appendix 2. Regression Results
| Dependent variable: | ||
| Approval of the mayor’s performance | Approval of the city council’s performance | |
| (1) | (2) | |
| Hromada Resilience Perception Scale | 0.04*** | 0.03*** |
| (0.002) | (0.002) | |
| Response | 0.09*** | 0.02 |
| (0.03) | (0.03) | |
| Satisfaction with public services | 0.19*** | 0.22*** |
| (0.04) | (0.04) | |
| Man | -0.02 | -0.06* |
| (0.03) | (0.03) | |
| Aged 26-35 | 0.04 | 0.03 |
| (0.07) | (0.07) | |
| Aged 36-60 | 0.08 | 0.12** |
| (0.06) | (0.05) | |
| >60 years old | 0.05 | 0.14** |
| (0.07) | (0.06) | |
| Income of UAH 6,000-10,000 | -0.01 | 0.03 |
| (0.04) | (0.03) | |
| Income of UAH 11,000-20,000 | -0.08 | 0.09* |
| (0.06) | (0.05) | |
| Income over UAH 21,000 | -0.04 | 0.04 |
| (0.10) | (0.09) | |
| Vocational education | -0.20*** | -0.11** |
| (0.05) | (0.05) | |
| Incomplete higher education | -0.08 | -0.01 |
| (0.07) | (0.06) | |
| Basic higher education (bachelor’s degree) | -0.20*** | -0.17*** |
| (0.05) | (0.04) | |
| Complete higher education | -0.24*** | -0.19*** |
| (0.05) | (0.05) | |
| Hostilities | 0.52*** | 0.24* |
| (0.15) | (0.13) | |
| Interaction effect: Response x Combat Actions | 0.16*** | 0.23*** |
| (0.06) | (0.05) | |
| Interaction effect: Satisfaction with Public Services x Combat Actions | -0.23*** | -0.19*** |
| (0.07) | (0.06) | |
| Constant | -0.17 | -0.0002 |
| (0.12) | (0.10) | |
| Observations | 2,394 | 2,394 |
| R2 | 0.27 | 0.30 |
| Adjusted R2 | 0.27 | 0.29 |
| Residual Std. Error (df = 2376) | 0.78 | 0.70 |
| F Statistic (df = 17; 2376) | 52.97*** | 58.79*** |
| Note: | *p<0.1; **p<0.05; ***p<0.01 | |


Attention
The authors do not work for, consult to, own shares in or receive funding from any company or organization that would benefit from this article, and have no relevant affiliations